Test driving your visualization – chart creation
With test environment ready, we can move on and develop a simple bar chart very similar to what we have done in the Creating a bar chart recipe in Chapter 8, Chart Them Up, though this time in a test-driven fashion. You can see how the bar chart looks if you open the tdd-bar-chart.html page:
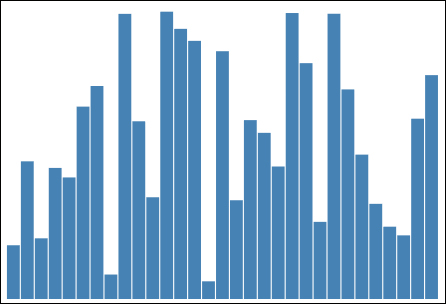
Test Driven Bar Chart
By now we all know very well how to implement a bar chart using D3; however, building a bar chart is not the focus of this recipe. Instead, we want to show how we can build test cases every step of the way and verify automatically that our bar chart implementation is doing what it is supposed ...
Get Data Visualization with D3.js Cookbook now with the O’Reilly learning platform.
O’Reilly members experience books, live events, courses curated by job role, and more from O’Reilly and nearly 200 top publishers.

