Part V. Visualizing Your Data with D3
In this part of the book, we take our hard-won Nobel Prize dataset, scraped from the web in Chapter 6 and cleaned in Chapter 9, and turn it into a modern, engaging, interactive web visualization using primarily the fantastic D3 library (see Figure V-1). We’ll deliver the main Nobel Prize dataset using the RESTful API we built in “Delivering Data to the Nobel Prize Visualization”, and the other data statically, as shown in “Delivering Static Files”.
We’ll cover the realization of the Nobel Prize dataviz in some detail, acquiring D3 and JavaScript knowledge as we go. First, let’s imagine what our visualization should be, using insights gained in Chapter 11.
You can find the Python and JavaScript source code for this visualization in the nobel_viz directory of the book’s GitHub repo (see “The Accompanying Code” for details).
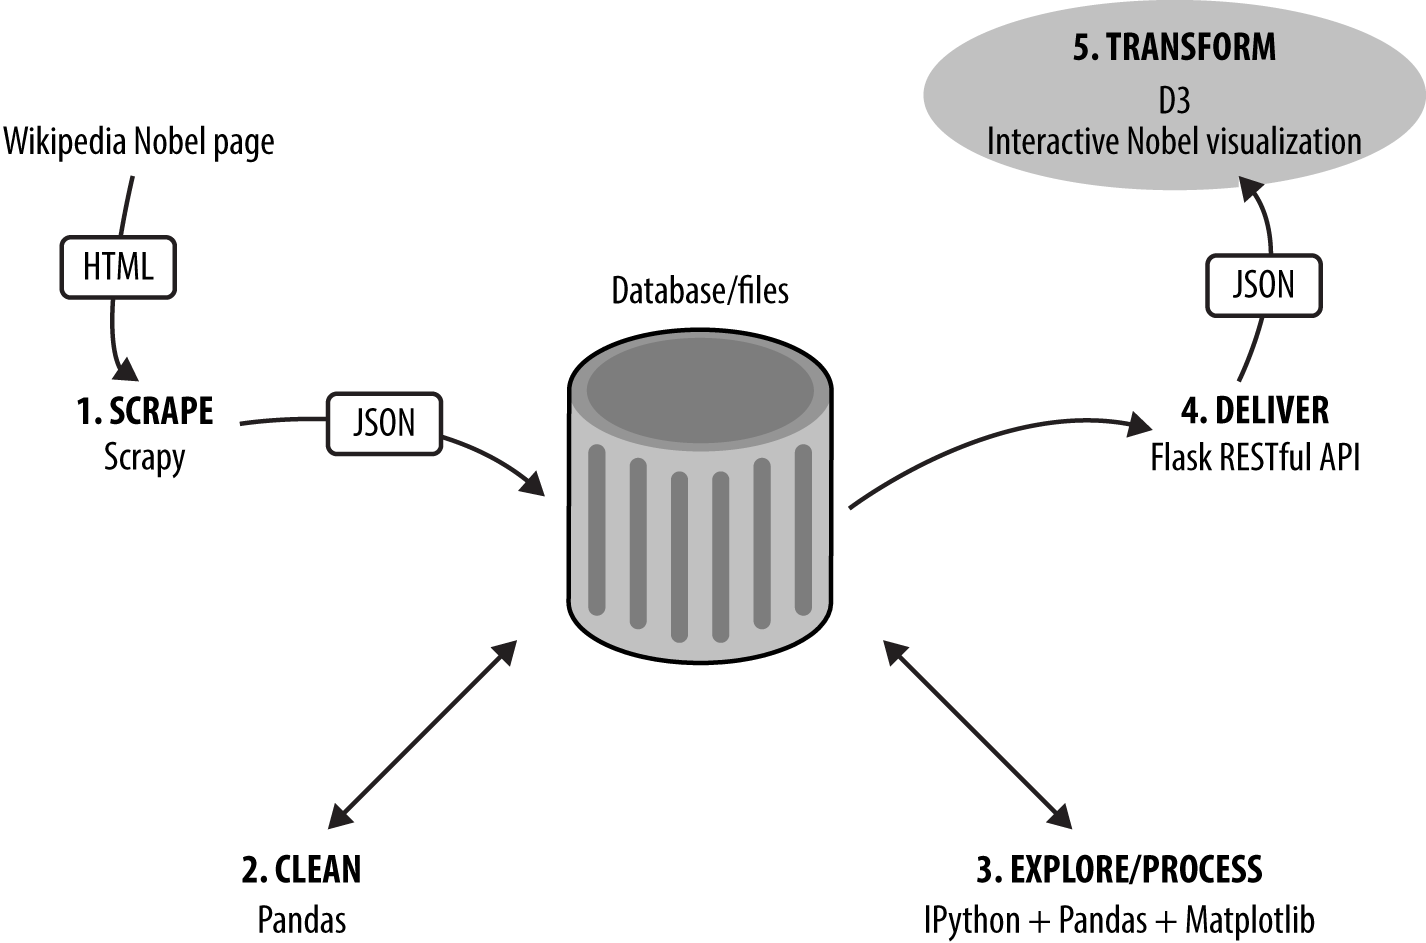
Figure V-1. Our dataviz toolchain: Getting the data
Get Data Visualization with Python and JavaScript now with the O’Reilly learning platform.
O’Reilly members experience books, live events, courses curated by job role, and more from O’Reilly and nearly 200 top publishers.

