Chapter 19. Visualizing Individual Winners
We want our Nobel Prize visualization (Nobel-viz) to include a list of currently selected winners and a biography box (aka bio-box) to display the details of an individual winner (see Figure 19-1). By clicking on a winner in the list the user can see his or her details in the bio-box. In this chapter, we’ll see how to build the list and bio-box, how to repopulate the list when the user selects new data (with the menu bar filters), and how to make the list clickable. We’ll also see how an AJAX call to our Eve API is used to get the biography data needed to update the bio-box (see “Delivering Data to the Nobel Prize Visualization”).
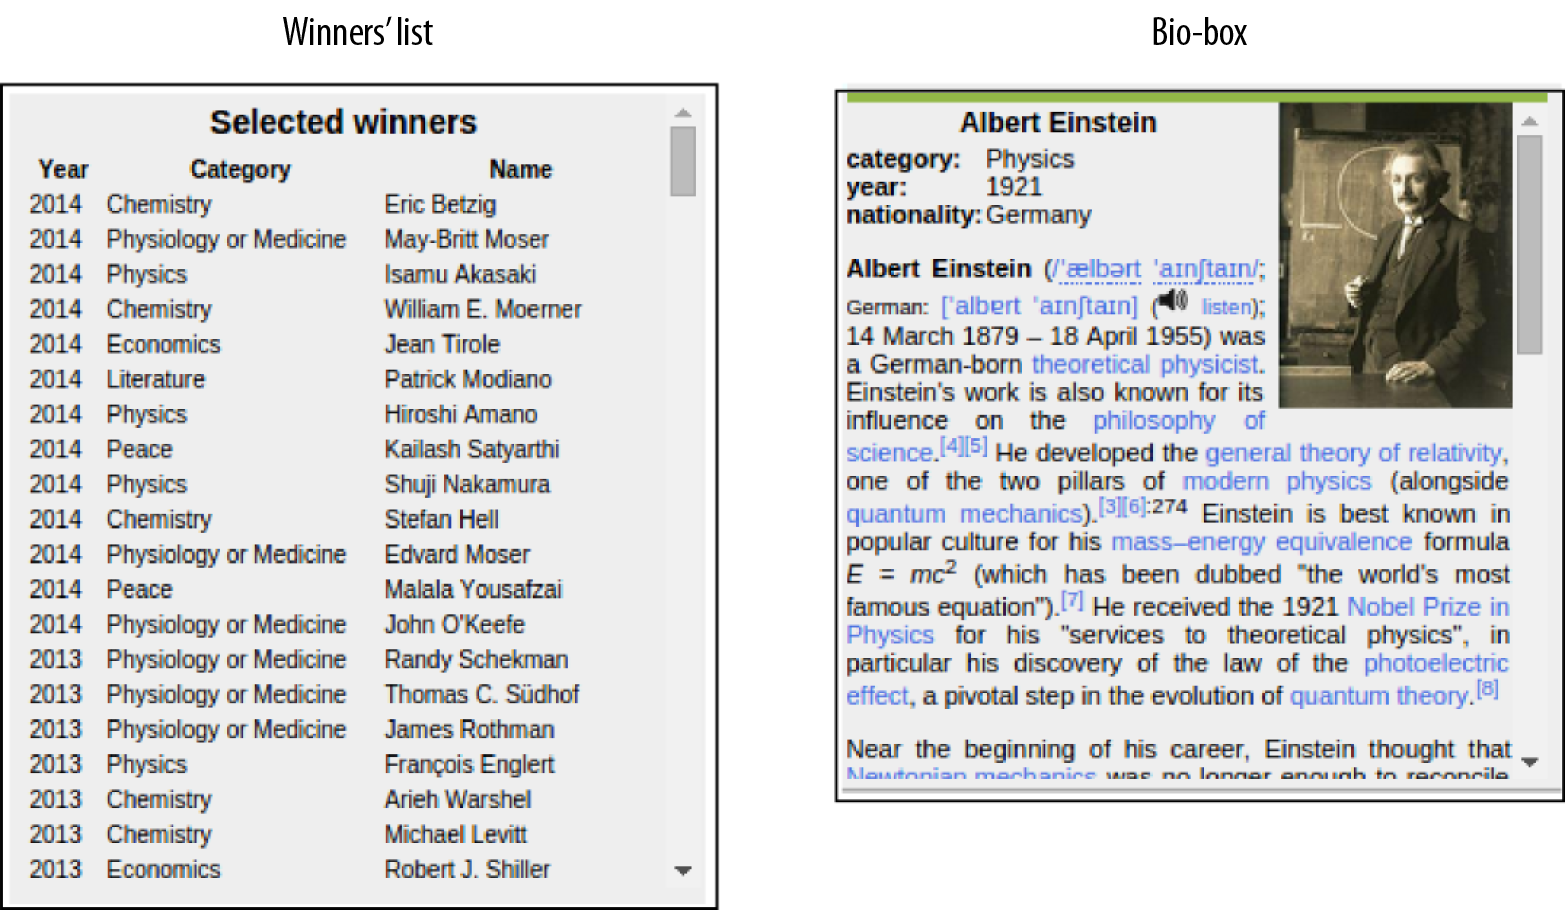
Figure 19-1. The chapter’s target elements
As this chapter will demonstrate, D3 isn’t just for building SVG visualizations. You can bind data to any DOM element and use it to change its attributes and properties or its event-handling callback functions. D3’s data joining and event handling (achieved via the on method) play very well with common user interfaces such as the clickable list of this chapter and selection boxes.1
Let’s deal first with the list of winners and how it is built with the dataset of currently selected winners.
Building the List
We build our list of winners (see Figure 19-1) using an HTML table with Year, Category, and Name columns. The basic skeleton of this list is provided in the Nobel-viz’s ...
Get Data Visualization with Python and JavaScript now with the O’Reilly learning platform.
O’Reilly members experience books, live events, courses curated by job role, and more from O’Reilly and nearly 200 top publishers.

