Statistics of Foreclosure
The same parsing, rendering of shapefiles, and geocoding of foreclosure events reviewed up to this point can be done in a number of other platforms. The real strength of R is found in its extensive statistical functions and libraries.
Importing Census Data
The US Census Bureau collects an extensive range of socioeconomic data that are interesting for our purposes. We can download some data involved in total population and total housing units that are indexed by the same tracts we have used for our map. FactFinder download center provides easy access to these data, as shown in Figure 5.
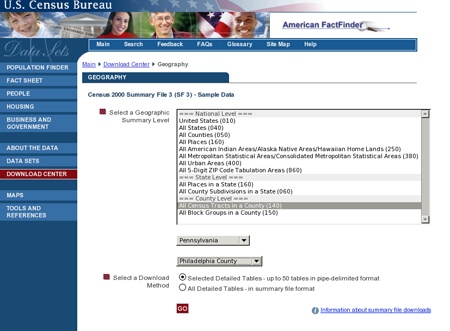
Figure 5.
Then, select All Census Tracts in a County→Pennsylvania→Philadelphia County→Selected Detailed Tables, as shown in Figure 6.
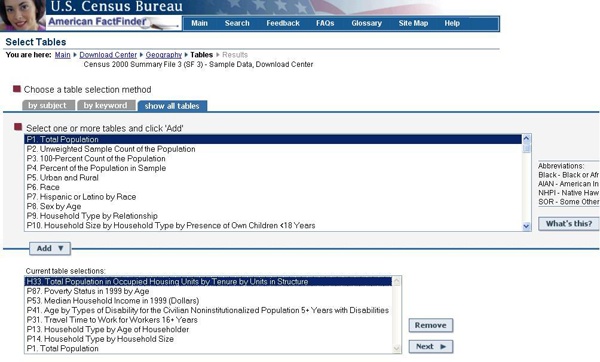
Figure 6.
Add the eight tables (P1,P13, P14, P31, P41, P53, P87,H33), click next, download, and unzip the file.
Import this data into R, and use the function, str(), to see the data contained in each column:
> censusTable1<-read.table("dc_dec_2000_sf3_u_geo.txt",sep="|",header=TRUE)> censusTable2<-read.table("dc_dec_2000_sf3_u_data1.txt",sep="|", header=TRUE,skip=1, na.string="")> colnames(censusTable2)[1] "Geography.Identifier" [2] "Geography.Identifier.1" [3] "Geographic.Summary.Level" [4] "Geography" [5] "Total.population..Total" [6] "Households..Total" ...
Get Data Mashups in R now with the O’Reilly learning platform.
O’Reilly members experience books, live events, courses curated by job role, and more from O’Reilly and nearly 200 top publishers.

