CHAPTER 19
![]()
Building for Sensitivity Analysis
In the previous chapters, you created a wizard that could take in and store user input. In this chapter, you’re going to create a dashboard that allows you to perform sensitivity analysis based on the metrics described in the previous chapter. Figure 19-1 provides a preview of what’s to come.
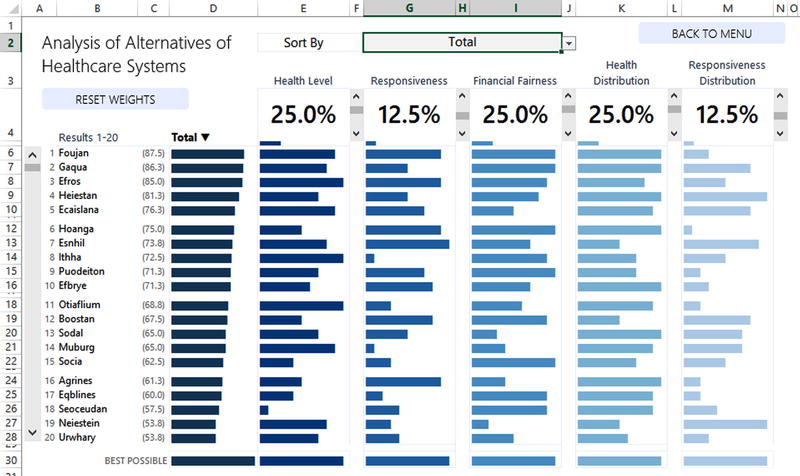
Figure 19-1. Analysis of alternatives decision support system
The tool shown in Figure 19-1 allows you to do many things quickly and efficiently, much of it with only a small amount of VBA code. As you’ll see, ...
Get Dashboards for Excel now with the O’Reilly learning platform.
O’Reilly members experience books, live events, courses curated by job role, and more from O’Reilly and nearly 200 top publishers.

