Now that we have our projection, we're going to generate <path> elements for each data element in the map_json.features array. Then, we will set the fill of each element to #099. Add the following to the end of app.js:
d3.select('svg').selectAll('path')
    .data(map_json.features)
    .enter()
    .append('path')
    .attr('fill', '#099');
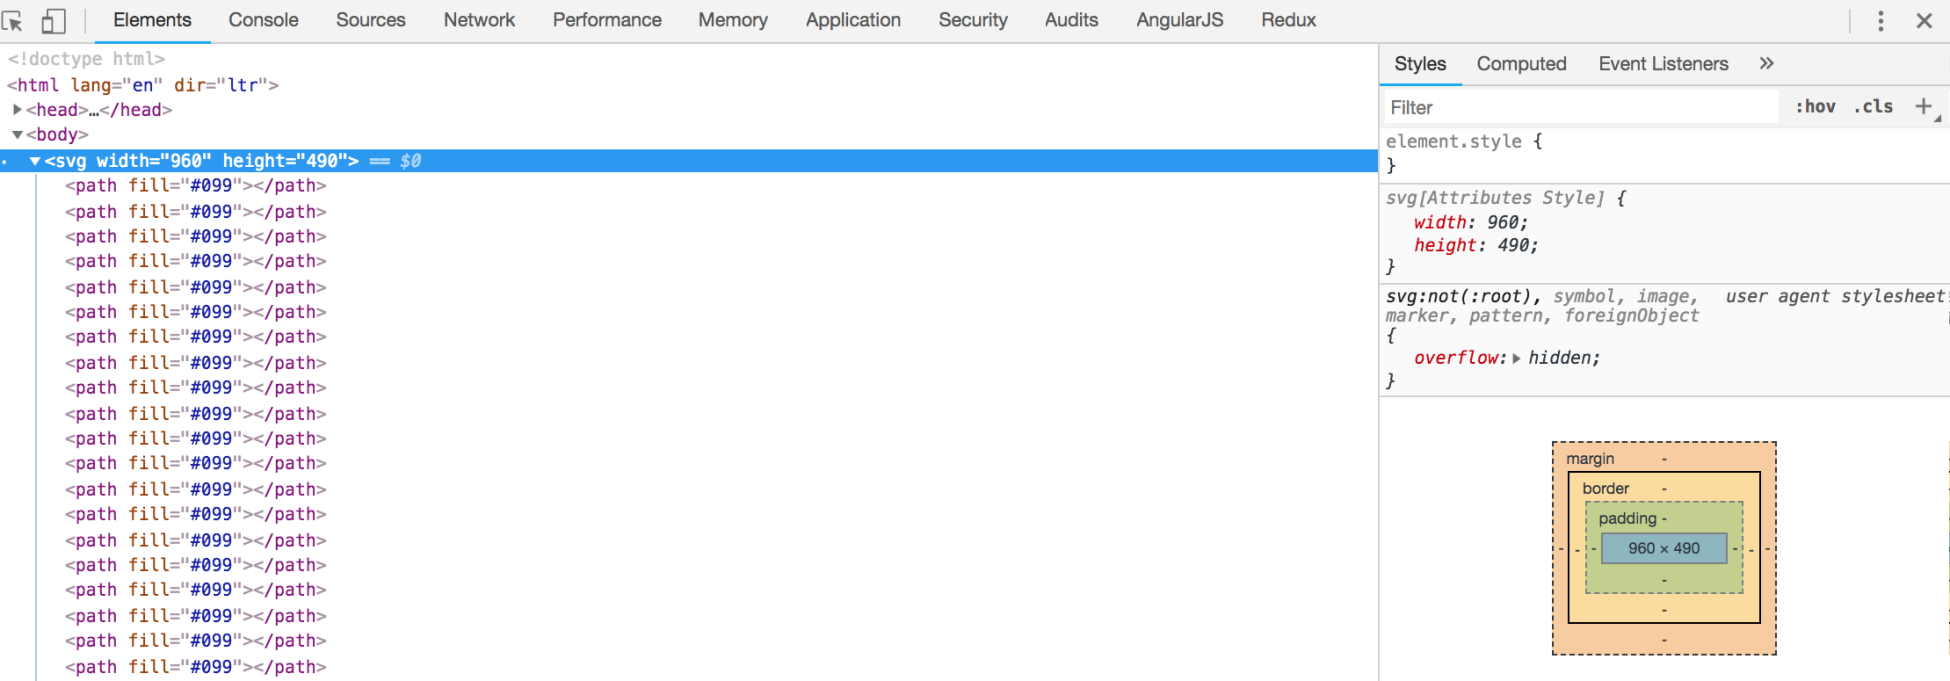
The following screenshot shows what it should look if we open index.html in Chrome and view the Elements tab in the Developer tools:
We created the path elements, but they each need a d attribute, which will determine how they will be drawn (that is, their shapes). ...

