Styling the map of the United States
Overall, this image is dark, and the borders between the states are not particularly visible. We can change this by providing a style for the fill and stroke values used to render the map.
The code for this example is available at the following link:
Note
bl.ock (12.2): https://goo.gl/chhKjz
When opening this URL, you will see the following map:
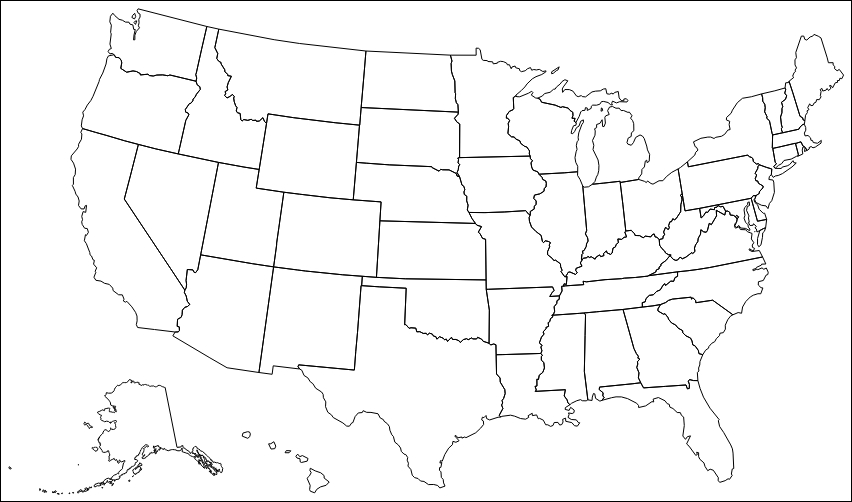
The only change to the previous example is to set the fill to transparent, and the borders to black:
svg.selectAll('path')
   .data(data.features)
   .enter()
   .append('path')
   .attr('d', path)
      .style({ fill: 'none', stroke: 'black' });
Using the albersUsa projection
You may have a ...
Get D3.js: Cutting-edge Data Visualization now with the O’Reilly learning platform.
O’Reilly members experience books, live events, courses curated by job role, and more from O’Reilly and nearly 200 top publishers.

