Representing relationships with chord diagrams
Chord diagrams demonstrate the relationships among a group of entities. To demonstrate, we will use the example available at the following link:
Note
bl.ock (10.7): http://goo.gl/8mRDSg
The resulting diagram is the following:
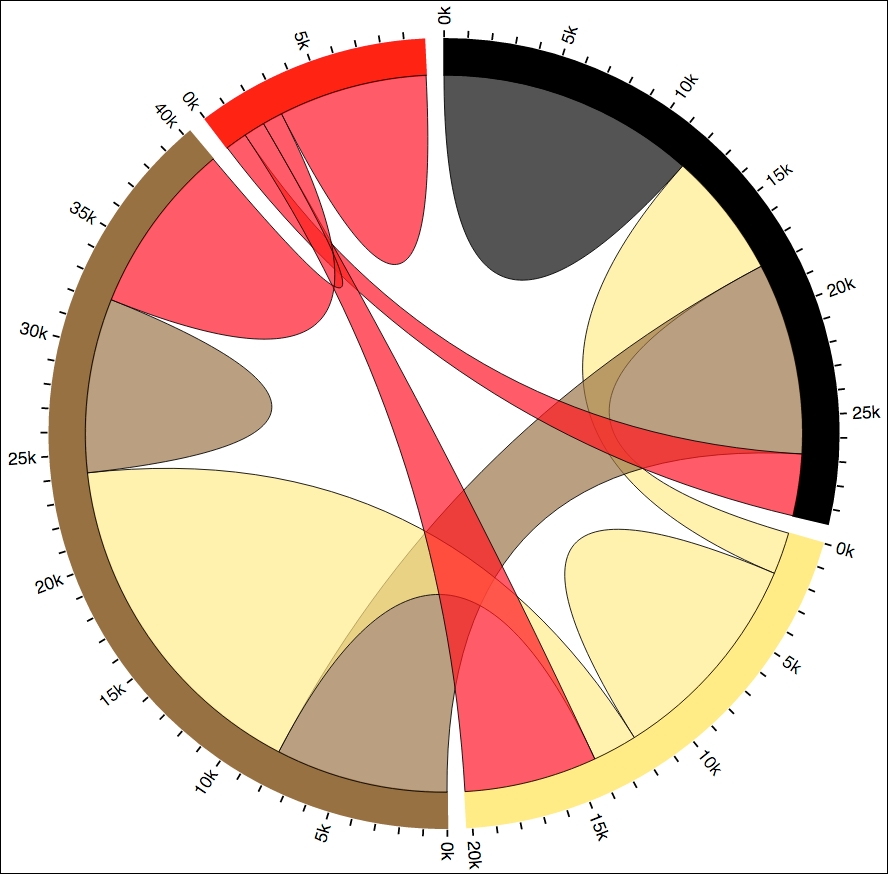
The data in this example is a square matrix of data, with rows and columns representing hair color (black, blonde, brown, and red). The data represents a total sample of 100000 measurements, where each row demonstrates the total count of the other hair colors which a person of a given hair color prefers:
|
Prefers | |||||
|
Has |
Black |
Blonde |
Brown |
Red |
Total |
|
Black |
11975 ... | ||||
Get D3.js: Cutting-edge Data Visualization now with the O’Reilly learning platform.
O’Reilly members experience books, live events, courses curated by job role, and more from O’Reilly and nearly 200 top publishers.

