10.1 Default Probability and Recovery Rates
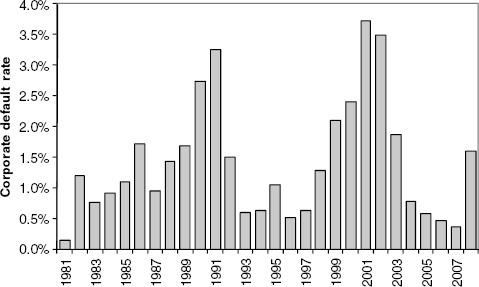
An example of historical default rates for investment- and speculative-grade assets is shown in Figure 10.1, illustrating that default rates tend to vary substantially through the economic cycle.
Figure 10.1 Corporate annual default rates (average of investment and speculative grade rates).
Source: Standard & Poor's (2008)
10.1.1 Defining Default Probability
In Appendix 10A we define default probability in more mathematical detail. We refer to the cumulative default probability, ![]() , which gives the probability of default any time from now (assuming the counterparty is not currently in default) until time t. This is illustrated in Figure 10.2. The function must clearly start from zero and tend towards 100% (every counterparty defaults eventually!). A marginal default probability, which is then the probability of a default between two specified future dates, is given by
, which gives the probability of default any time from now (assuming the counterparty is not currently in default) until time t. This is illustrated in Figure 10.2. The function must clearly start from zero and tend towards 100% (every counterparty defaults eventually!). A marginal default probability, which is then the probability of a default between two specified future dates, is given by
(10.1) ![]()
Figure 10.2 Illustration of cumulative default probability function, ![]() , and marginal default probability, .
, and marginal default probability, .
We can see that must be monotonically increasing to avoid marginal ...
Get Counterparty Credit Risk and Credit Value Adjustment: A Continuing Challenge for Global Financial Markets, 2nd Edition now with the O’Reilly learning platform.
O’Reilly members experience books, live events, courses curated by job role, and more from O’Reilly and nearly 200 top publishers.

