APPENDIX B
LIFE EXPECTANCY AND QUALITY-ADJUSTED LIFE EXPECTANCY TABLES
TABLE B.1. Abridged Life Table for the Total Population, 2003
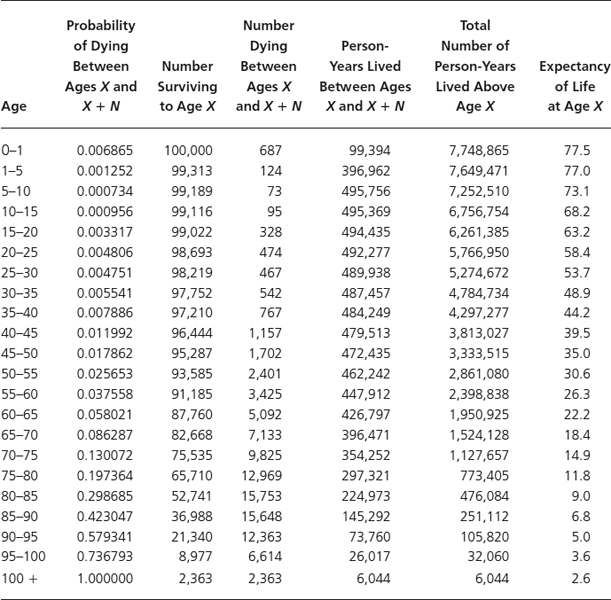
Source: Centers for Disease Control and Prevention, National Center for Health Statistics.
TABLE B.2. Life Expectancy at Selected Ages by Race and Sex. United States, 2003
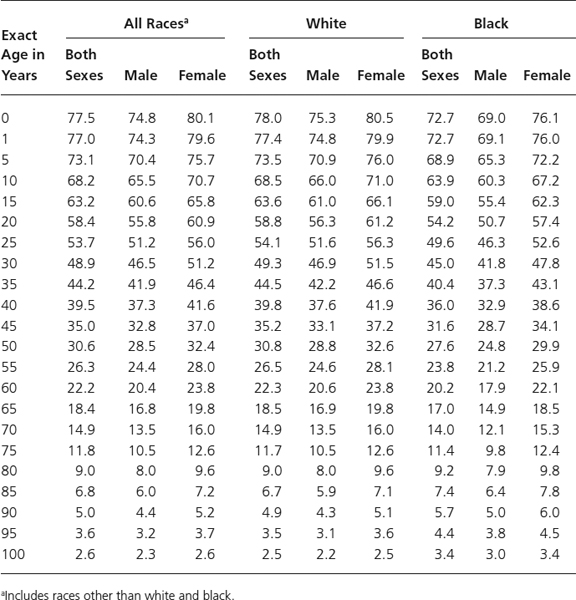
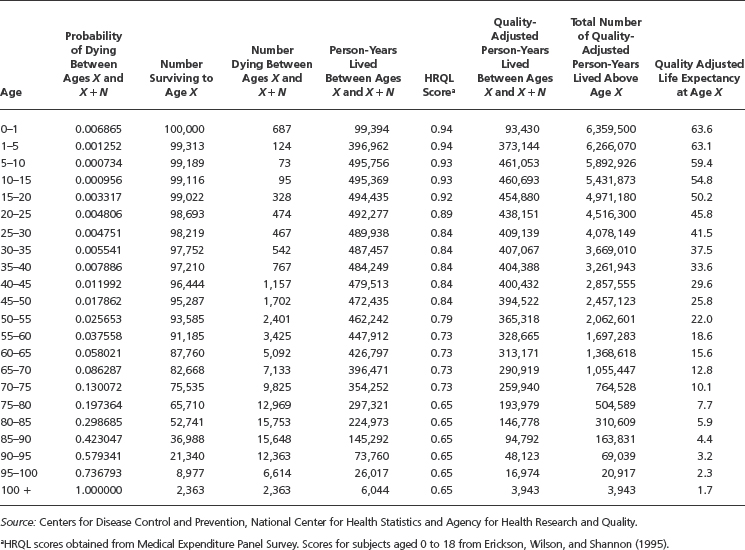
TABLE B.3. Abridged Quality-Adjusted Life Table for the Total Population, 2003
Get Cost-Effectiveness Analysis in Health: A Practical Approach, 2nd Edition now with the O’Reilly learning platform.
O’Reilly members experience books, live events, courses curated by job role, and more from O’Reilly and nearly 200 top publishers.

