Explore the Network
The following figure is a Gephi rendering of G. The “Complex Network” node is barely visible right in the middle of the image denoted with a darker color. Node and label font sizes represent the indegrees. The most in-connected, most significant nodes are in the upper-left corner of the network. What are they?
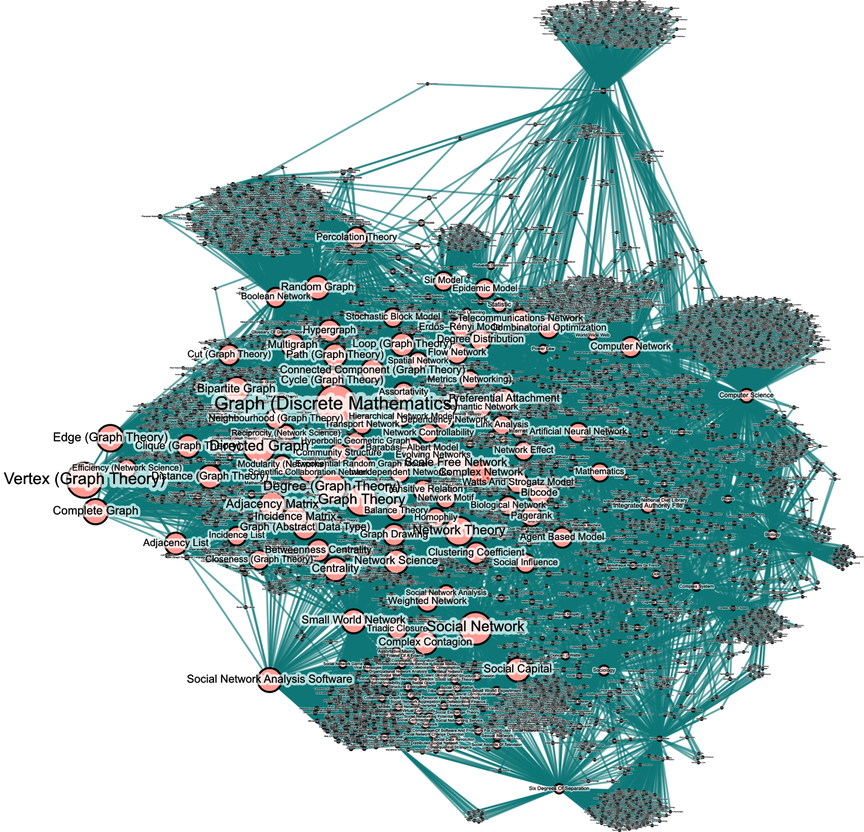
The last code fragment of the exercise efficiently calculates the answer by calling the method G.in_degree. The method (and its sister method G.out_degree) are very similar to G.degree except that they report different edge counts in the form of objects InDegreeView and OutDegreeView, respectively.
| | top_indegree ... |
Get Complex Network Analysis in Python now with the O’Reilly learning platform.
O’Reilly members experience books, live events, courses curated by job role, and more from O’Reilly and nearly 200 top publishers.

