RUM Reporting: Individual and Aggregate Views
RUM yields two kinds of data: individual visits and aggregate reports.
Individual visits are great for diagnosing an issue or examining why a particular page was good for a particular user. They’re the primary use of RUM in troubleshooting and customer support environments. They usually consist of a list of pages within a visit, along with timing information; in some products, each page can be viewed as a cascade diagram of container and component load times.
While looking at individual visits is useful, however, it’s important to recognize that if you worry about a problem affecting only one visitor, you may overlook a more significant, widespread issue.
Aggregate calculations, on the other hand, give you a broad view of the application as a whole, as shown in Figure 10-10. They can, for example, show you a particular metric (“host latency”) across a segment of your traffic (“the login page”, “users from Boston”, or “handled by server 10”).
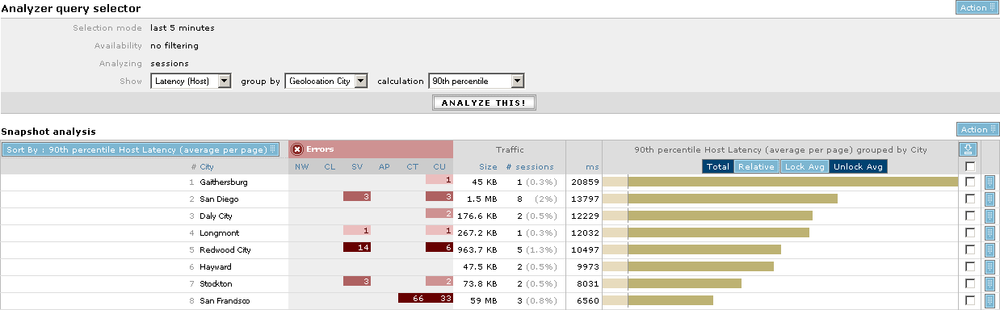
Figure 10-10. An aggregate report of host latency by city across visitor sessions in Coradiant TrueSight
Aggregation also means making Top-N lists, which helps to prioritize your efforts by showing you the slowest, most errored, or busiest elements of your infrastructure. Finally, aggregate data is the basis for baselining, which decides what’s normal for a particular region or page, and lets you know when ...
Get Complete Web Monitoring now with the O’Reilly learning platform.
O’Reilly members experience books, live events, courses curated by job role, and more from O’Reilly and nearly 200 top publishers.

