Measuring by Hand: Developer Tools
Your job is to understand end user experience once a system is in production. Long before you deploy the application, your developers will have been using tools to estimate its performance. These include sniffers that can decode network traffic and find granular protocol issues, desktop software that measures responsiveness and suggests corrections, and hosted services that test a page from several locations to analyze its load time across the Internet.
If we’ve done our job explaining the elements of web performance, you’ll be able to understand the results of these tools and pinpoint areas for optimization.
Network Problems: Sniffing the Wire
There’s an old saying in networking: sniffers don’t lie. Seeing the actual TCP/IP conversations that flow across a network connection and reassembling them into the HTTP transactions between a server and a browser is a time-consuming effort. It’s also the best way to find out what really happened.
Wireshark (formerly known as Ethereal), shown in Figure 8-38, is the leading free packet sniffer. You can narrow the traffic it captures to a single TCP/IP session and reassemble the HTTP objects from the data stream. You can also use timing information to measure performance extremely precisely.
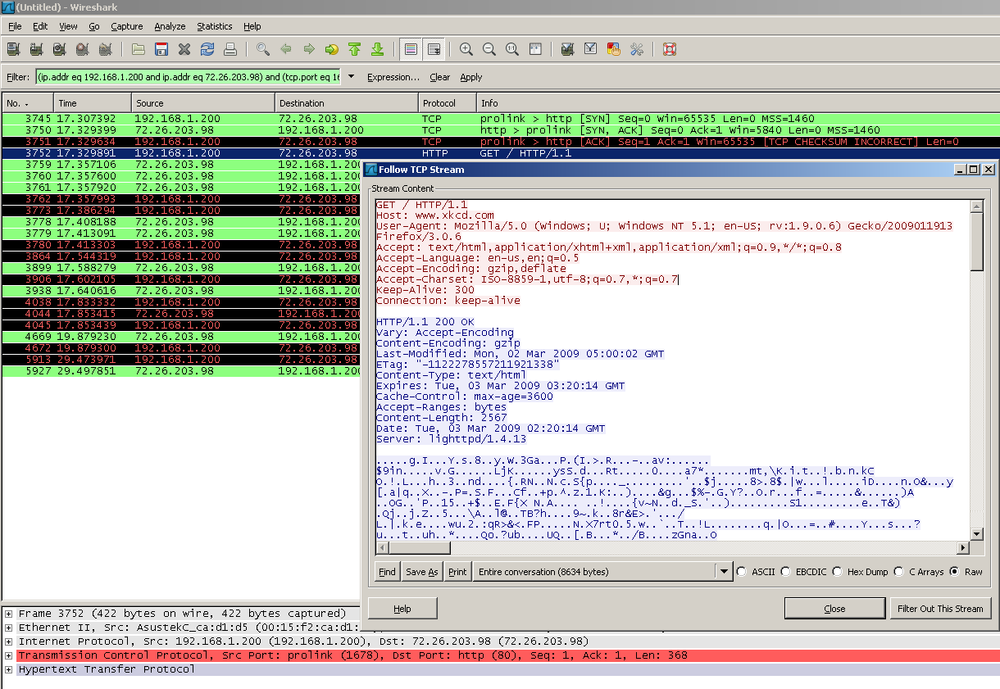
Figure 8-38. Wireshark, a popular open source packet analyzer, allows granular analysis of network traffic
If you want to understand ...
Get Complete Web Monitoring now with the O’Reilly learning platform.
O’Reilly members experience books, live events, courses curated by job role, and more from O’Reilly and nearly 200 top publishers.

