GRAPHICS
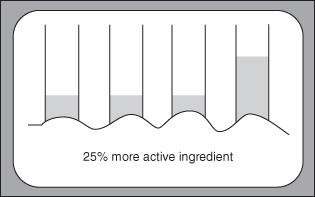
Beware of missing baselines, as in Figure 9.1. Be wary of extra dimensions that inflate relative proportions (see Chapter 10). Distrust curves that extend beyond the plotted data. Check to see that charts include all datapoints, not just some of them.
FIGURE 9.1. Misleading baseline data makes true comparisons impossible.
The data for Figure 9.2, supplied by the California Department of Education, are accurate. The title added by an Orange County newspaper is not. Although enrollment in the Orange County public schools may have been steadily increasing in the last quarter of the 20th Century, clearly it has begun to level off and even to decline in the 21st.
FIGURE 9.2. Enrollment in Orange County Public Schools from 1977 to 2007.
Source: California Department of Education. The misleading title was added by an Orange County newspaper. Data are downloadable from http://www.cde.ca.gov/ds/sd/sd.
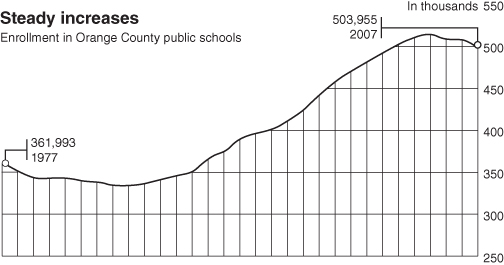
Finally, as noted in the next chapter, starting the Y-axis at 250,000 rather than 0 leaves the misleading impression that the increase is much larger than it actually is.
Get Common Errors in Statistics (and How to Avoid Them), 4th Edition now with the O’Reilly learning platform.
O’Reilly members experience books, live events, courses curated by job role, and more from O’Reilly and nearly 200 top publishers.

