STANDARD ERROR
One of the most egregious errors in statistics, one encouraged, if not insisted upon by the editors of journals in the biological and social sciences, is the use of the notation “Mean ± Standard Error” to report the results of a set of observations.
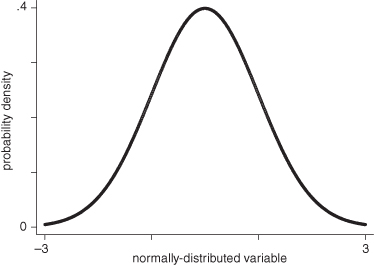
The standard error is a useful measure of population dispersion if the observations are continuous measurements that come from a normal or Gaussian distribution. If the observations are normally distributed as in the bell-shaped curve depicted in Figure 8.2, then in 95% of the samples we would expect the sample mean to lie within two standard errors of the mean of our original sample.
FIGURE 8.2. Bell-shaped symmetric curve of a normal distribution.
But if the observations come from a nonsymmetric distribution such as an exponential or a Poisson, or a truncated distribution such as the uniform, or a mixture of populations, we cannot draw any such inference.
Recall that the standard error equals the standard deviation divided by the square root of the sample size, ![]() or
or ![]() .
.
As the standard error depends on the squares of individual observations, it is particularly sensitive to outliers. A few extreme or outlying observations ...
Get Common Errors in Statistics (and How to Avoid Them), 4th Edition now with the O’Reilly learning platform.
O’Reilly members experience books, live events, courses curated by job role, and more from O’Reilly and nearly 200 top publishers.

