Debugging a COM+ application, be it a library or a server application, is not much different from debugging an in-proc COM object or a local server. A library application has the clear advantage of allowing you to step through your code directly from the test client, since a library and a server application share the same process. A server application always runs in a different process than your test client and, therefore, in a different debug session (a different instance of Visual Studio is attached to that process). When debugging the business logic part of your application, you may find it useful to debug it as a library application, even if the design calls for a server application. When debugging a library application, you may also need to point Visual Studio to the exact location of the component’s DLLs. This step is required so you can set breakpoints in the component’s code.
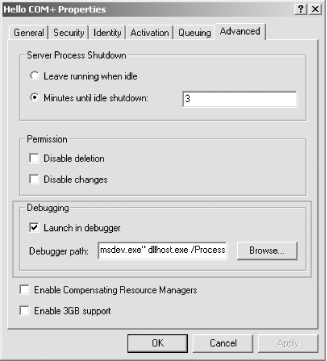
When debugging a component in a server application, you can step into the component’s code from the test client side in two ways. First, you can start the client project in the debugger, break at a line where you call a method on a component in the server application, and simply step into it (F11 in Visual C++ or F8 in Visual Basic). This process launches a new instance of the debugger and attaches it to the running dllhost containing your component. You can then step through your component’s code. Second, you can attach a debugger to a server application by configuring it to launch in a debugger. On the server application properties page, under the Advanced tab, there is the Debugging properties group. If you check the Launch in debugger checkbox (see Figure 1-12), when the first request for creating an object from that application comes in, COM+ launches the application in a Visual C++ debugger session. You may use this option often to track bugs in the constructors of components or bugs that do not happen in the scope of a client call. COM+ is able to attach the debugger to the application using a command-line option for Visual Studio. When you launch the debugger with an executable filename as a parameter, the debugger starts a debug session and creates the specified process (in COM+’s case, always dllhost). COM+ also specifies the server application ID as a command line parameter for dllhost:
msdev.exe dllhost.exe /ProcessID:{CCF0F9D9-4500-4124-8DAF-B7CF8CBC94AC}This code informs dllhost that it is now associated with the specified server application.
Get COM & .NET Component Services now with the O’Reilly learning platform.
O’Reilly members experience books, live events, courses curated by job role, and more from O’Reilly and nearly 200 top publishers.

