The browser simulation
An HTML page has been supplied in the resources directory of the sample project. Open the page in any modern browser and you should see something similar to the following image:
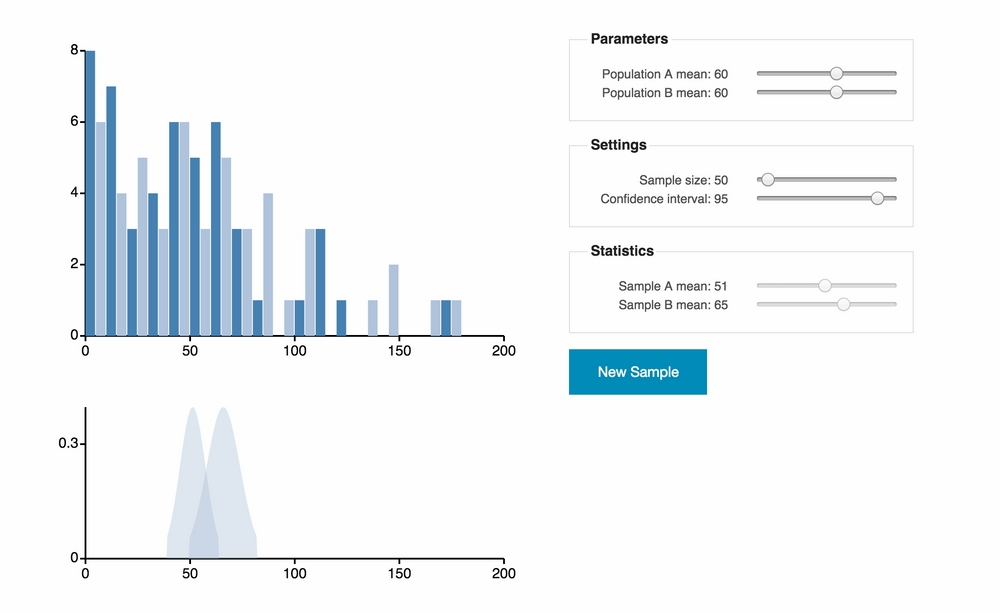
The left of the page shows a dual histogram with the distribution of two samples, both taken from an exponential distribution. The means of the populations from which the samples are generated are controlled by the sliders at the top right corner of the web page in the box marked as Parameters. Underneath the histogram is a plot showing the two probability densities for the population means based on the samples. These are calculated using the t-distribution, ...
Get Clojure for Data Science now with the O’Reilly learning platform.
O’Reilly members experience books, live events, courses curated by job role, and more from O’Reilly and nearly 200 top publishers.

