Visualizing different populations
Let's remove the filter for weekdays and plot the daily mean dwell time for both week days and weekends:
(defn ex-2-12 []
  (let [means (->> (load-data "dwell-times.tsv")
                   (with-parsed-date)
                   (mean-dwell-times-by-date)
                   (i/$ :dwell-time))]
    (-> (c/histogram means
                     :x-label "Daily mean dwell time unfiltered (s)"
                     :nbins 20)
        (i/view))))
The code generates the following histogram:
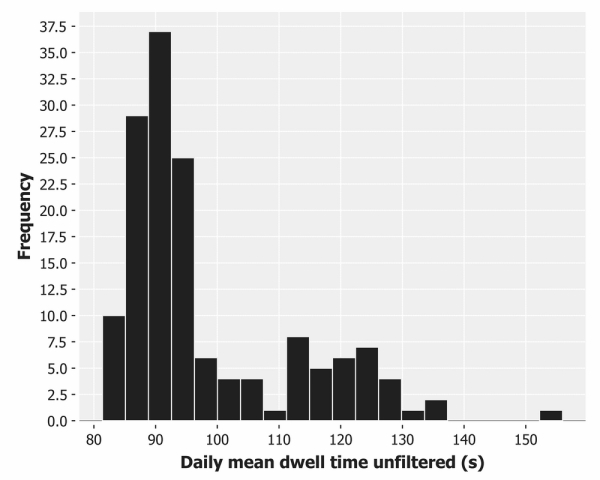
The distribution is no longer a normal distribution. In fact, the distribution is bimodal—there are two peaks. The second smaller peak, which corresponds to the newly added weekend data, is lower both because there are not as many weekend days as weekdays ...
Get Clojure for Data Science now with the O’Reilly learning platform.
O’Reilly members experience books, live events, courses curated by job role, and more from O’Reilly and nearly 200 top publishers.

