Visualizing the dwell times
We can plot a histogram of dwell times by simply extracting the :dwell-time column with i/$:
(defn ex-2-2 []
  (-> (i/$ :dwell-time (load-data "dwell-times.tsv"))
      (c/histogram :x-label "Dwell time (s)"
                   :nbins 50)
      (i/view)))
The earlier code generates the following histogram:
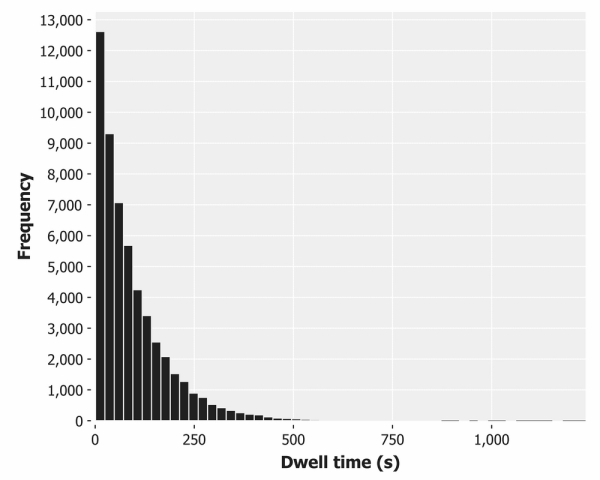
This is clearly not a normally distributed data, nor even a very skewed normal distribution. There is no tail to the left of the peak (a visitor clearly can't be on our site for less than zero seconds). While the data tails off steeply to the right at first, it extends much further along the x axis than we would expect from normally distributed data.
Get Clojure for Data Science now with the O’Reilly learning platform.
O’Reilly members experience books, live events, courses curated by job role, and more from O’Reilly and nearly 200 top publishers.

