Visualizing the Russian election data
We previously saw that a histogram of the UK election turnout was approximately normal (albeit with light tails). Now that we've loaded and transformed the Russian election data, let's see how it compares:
(defn ex-1-30 []
  (-> (i/$ :turnout (load-data :ru-victors))
      (c/histogram :x-label "Russia turnout"
                   :nbins 20)
      (i/view)))
The preceding example generates the following histogram:
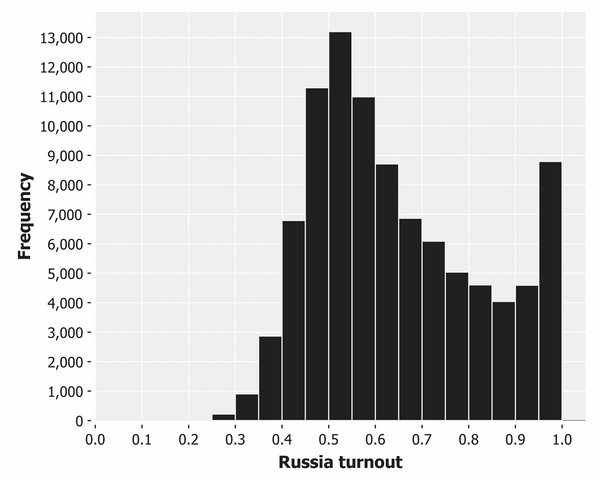
This histogram doesn't look at all like the classic bell-shaped curves we've seen so far. There's a pronounced positive skew, and the voter turnout actually increases from 80 percent towards 100 percent—the opposite of what we would expect ...
Get Clojure for Data Science now with the O’Reilly learning platform.
O’Reilly members experience books, live events, courses curated by job role, and more from O’Reilly and nearly 200 top publishers.

