CHAPTER 2
Charts and Graphs
LEARNING OBJECTIVES
The overall objective of Chapter 2 is for you to master several techniques for summarizing and depicting data, thereby enabling you to:
- Construct a frequency distribution from a set of data
- Construct different types of quantitative data graphs, including histograms, frequency polygons, ogives, dot plots, and stem-and-leaf plots, in order to interpret the data being graphed
- Construct different types of qualitative data graphs, including pie charts, bar graphs, and Pareto charts, in order to interpret the data being graphed
- Recognize basic trends in two-variable scatter plots of numerical data
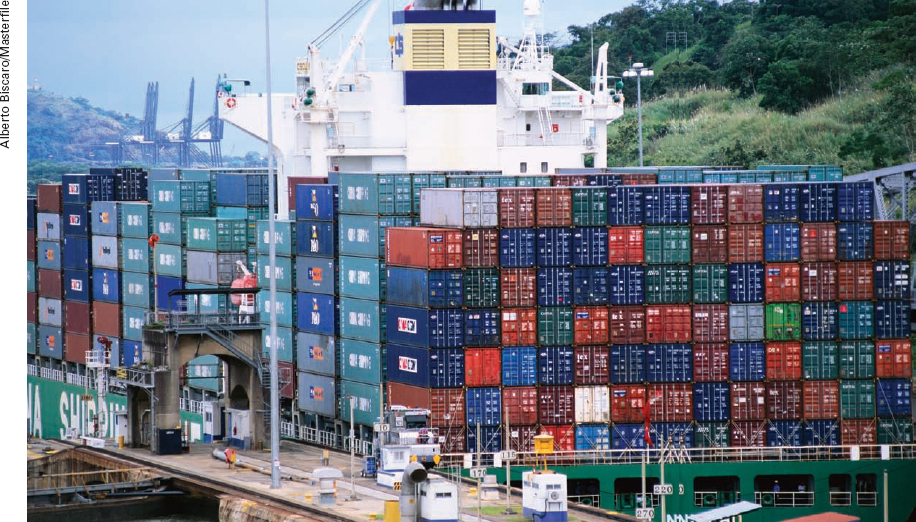
 Container Shipping Companies
 For decades, business people in many countries around the world wrestled with the issue of how to store and ship goods via trucks, trains, and ships. Various sizes and shapes of containers were developed to ship goods even within a country. The lack of consistent containers created a lot of extra work, as products were relocated from one container to another. Fortunately, in 1955 a former trucking company executive teamed up with an engineer to develop a version of the modern intermodal container that is widely used ...
Get Business Statistics: For Contemporary Decision Making, 7th Edition now with the O’Reilly learning platform.
O’Reilly members experience books, live events, courses curated by job role, and more from O’Reilly and nearly 200 top publishers.

