Appendices
Table A.1: Random Numbers
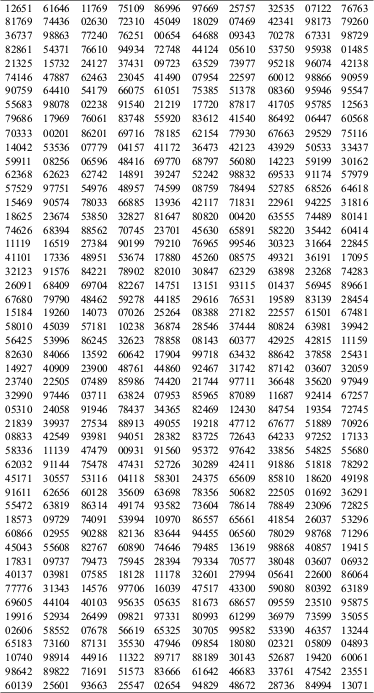
Source: Partially extracted from The RAND Corporation, A Million Random Digits with 100,000 Normal Deviates (Glencoe, IL, The Free Press, 1955).
Table A.2: Areas of the Standard Normal Distribution
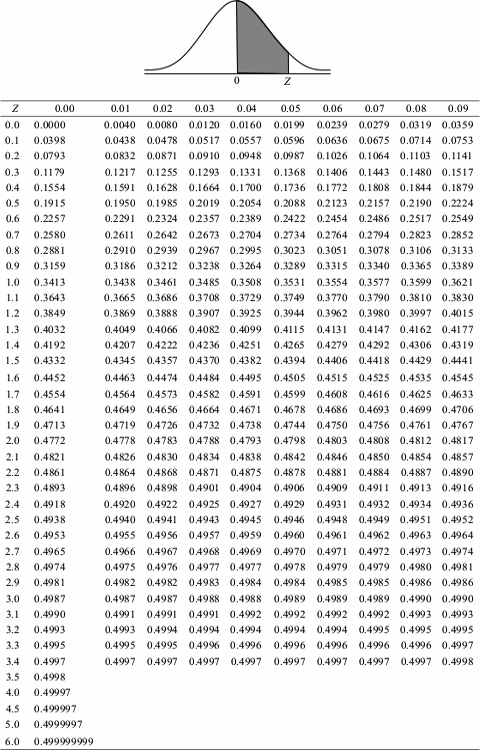
The entries in this table are the probabilities that a standard normal random variable is between 0 and Z (the shaded area).
Table A.3: Critical Values from the t Distribution
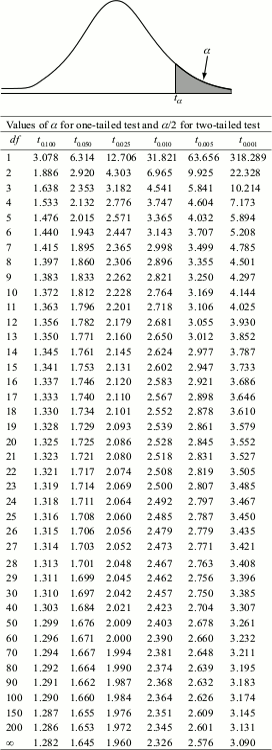
Table A.4: Percentage ...
Get Business Research Methods now with the O’Reilly learning platform.
O’Reilly members experience books, live events, courses curated by job role, and more from O’Reilly and nearly 200 top publishers.

