Potential Coverage Problem Areas
While a spectrum analyzer (and an engineer to operate it) is the ultimate survey tool, such things don’t come cheap. Fortunately, you can get a lot of useful information using a good quality client radio and software. Take a look at the tools that come with your wireless gear (Lucent’s Site Monitor tool, shown in Figure 2-2, which ships with Orinoco cards, is particularly handy). You should be able to get an overview map of all networks in range and which channels they’re using.
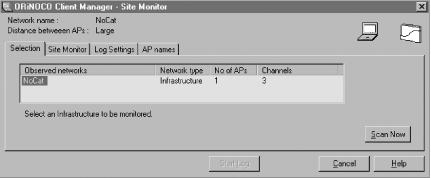
Figure 2-2. Lucent’s Site Monitor tool shows you who’s using 802.11b in your area
Other (non-802.11b) sources of 2.4GHz radio emissions show up as noise on your signal strength meter. If you encounter a lot of noise on the channel you’d like to use, you can try to minimize it by moving your access point, using a more directional antenna (see Chapter 6), or simply picking a different channel. While you always want to maximize your received signal, it is only usable if the ambient noise is low. The relationship of signal to noise is critical for any kind of communications. It is frequently abbreviated as SNR, for signal to noise ratio. As this number increases, so does the likelihood that you’ll have reliable communications. (For fine examples of low SNR, kindly consult your local Usenet feed.)
Of course, no known technology can determine the SNR of the actual data you’re transmitting ...
Get Building Wireless Community Networks now with the O’Reilly learning platform.
O’Reilly members experience books, live events, courses curated by job role, and more from O’Reilly and nearly 200 top publishers.

