Chapter 1. Getting Familiar with techBASIC and Built-in Sensors
Your Own Tricorder
I was always a little jealous when Spock pulled out his tricorder on Star Trek and began measuring practically every physical value you could imagine. It’s staggering how far technology has come, though. I carry a tricorder around in my pocket all the time now! Mine measures acceleration, rotation, and magnetic fields, giving both the strength and direction of each. It’s not quite as sophisticated as Spock’s, but it’s also not so large and clunky.
This book is all about using your iPhone and iPad to control electronic devices, often sensors. We’re going to start off with the sensors that are built right in, so you can pop out your tricorder and measure stuff, too.
A Crash Course in techBASIC
We’ll get started on the first instrument for our tricorder in a moment. First, though, let’s take a look at the language we’ll use for programming.
Our programs will be developed in a technical programming language called techBASIC, available in the App Store. There are a number of reasons for using techBASIC instead of Objective C, the programming language used to write most apps (including techBASIC). Here are some of the big ones:
- techBASIC runs right on your iPhone or iPad. You don’t have to use, or even own, a Macintosh computer to write or run these programs.
- techBASIC is less expensive. While Xcode (the development environment for Objective C) is free, you must join Apple’s developer program to actually move programs to your iOS device. That costs $99 every year. techBASIC costs $14.99 one time.
- techBASIC is simpler. It’s designed specifically for writing technical programs and connecting to external devices. Programs that would take a half-dozen to a dozen classes, each with a half-dozen to a dozen methods, can often be written with just a few lines in techBASIC.
- techBASIC is easier to learn and more forgiving than Objective C, so you can concentrate on the fun part—writing the programs to control the Internet of Things.
techBASIC Sampler
There is a free version of techBASIC called techBASIC Sampler. It’s also displayed in some places with the shortened name techSampler. The free version lets you view and run all of the samples that come with techBASIC. All of the programs from this book are samples in techBASIC, so you can use the free version to run the programs. You can even use the debugger to trace through the programs. The only limitation is editing. techBASIC Sampler doesn’t let you change a program or create a new one. When you try to edit a program or create a new one, techBASIC Sampler will invite you to upgrade to the full version of techBASIC using an in-app purchase. You can do that or just buy techBASIC.
That said, there are a couple of places in the book where we will create very short programs that are not preloaded as samples. These are typically used to show a simple feature before it gets buried in a longer program or to show how to use techBASIC. You can skip entering those programs without missing anything significant.
We’ll just talk about techBASIC in the book, but other than editing, you can always perform the same tasks with techBASIC Sampler.
Running Your First Program
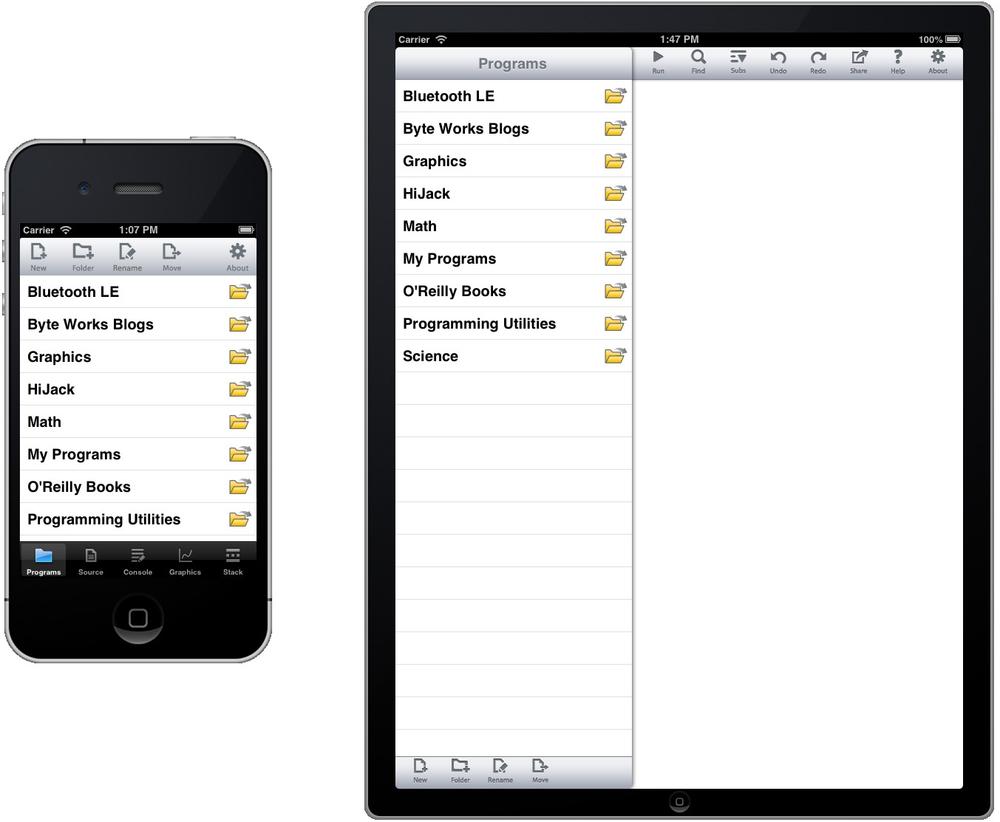
Crank up techBASIC and you will see a display something like Figure 1-1, depending on the device you are using. If you are using an iPad and holding it in portrait view, tap the Programs button at the top left of the screen to see the list of programs. The iPhone will start off showing the programs, but if you switch to another display, you can switch back by tapping the Programs button at the lower left of the iPhone display.
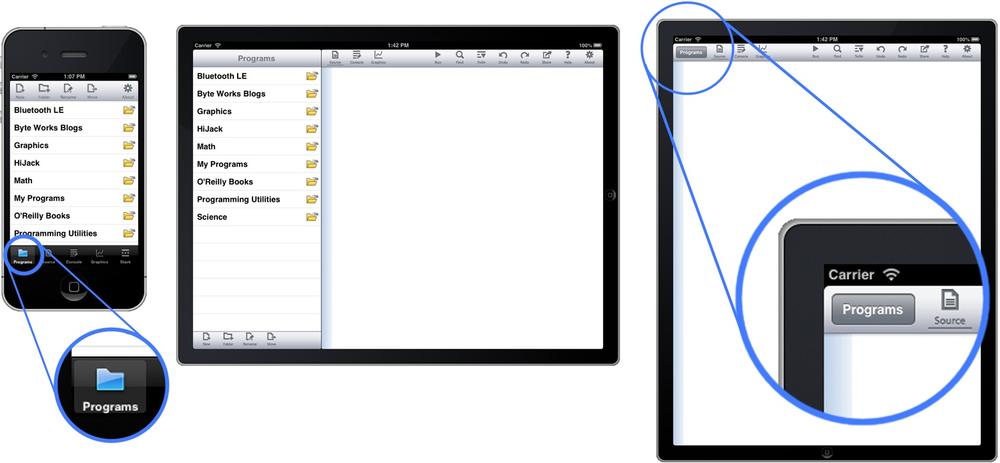
The program list shows all of the sample programs, contained in folders used to organize them. One of the folders is called O’Reilly Books, as shown in Figure 1-2. Tap the name and it will expand to show the programs in the folder. Tap the Programs navigation button at the top of the screen and the folder closes, moving you back to the original list of folders.
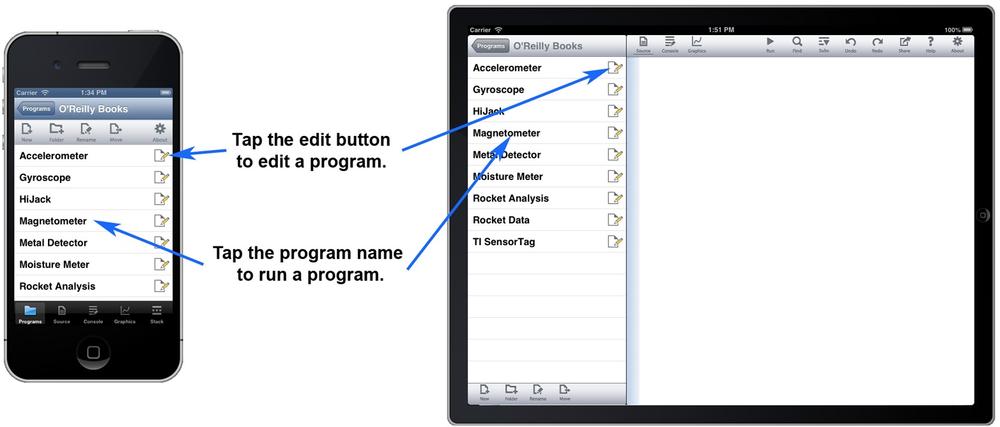
One of the programs is called Accelerometer. Tap the Edit button next to the program’s name to see the source code for the program. On the iPhone, you can tap the Programs button to get back to the program list.
You run a program by tapping on the name of the program, as shown later in Figure 1-7. Give the accelerometer a try. The display will shift to the graphics screen, where you’ll see a constantly updating plot of the acceleration experienced by the iPhone or iPad, as shown in FIG 1-4. The accelerometer is the first sensor for our tricorder, and we’ll dig into the program in detail in a moment. Stop the program by tapping the Quit button.
Creating a Program
Our first techBASIC program will turn on the accelerometer built into the iPhone or iPad; read the acceleration along the vertical axis, the horizontal axis, and through the screen of the device; record the time when the measurement was made; and print these values. It will then turn off the accelerometer to preserve battery life.
It sounds like a pretty sophisticated program, and it is. Here’s the source code:
PRINT Sensors.accel
Let’s see how it works. Sensors is the name of a class that is built into techBASIC. It’s the class used to access all of the sensors that are built into the iPhone and iPad. One of the methods in the Sensors class is accel. It returns an array of four values: the current acceleration along the x-axis (vertically through the device), the y-axis (horizontally through the device), and the z-axis (perpendicular to the screen), and a timestamp indicating exactly when the reading was made.
PRINT is a statement in BASIC that prints any value, from numbers to strings to arrays. In this case, it prints all four values from the array returned by Sensors.accel.
It’s time to enter the program and run it. If you are still in the O’Reilly Books folder, back up to the top folder level by tapping the Programs navigation button just above the list of programs.
From the program list, tap the My Programs folder. Tapping the name of a folder not only opens the folder, it also indicates which folder the program you’re about to create will be placed in. Now tap the New button. You will see a dialog like Figure 1-4.
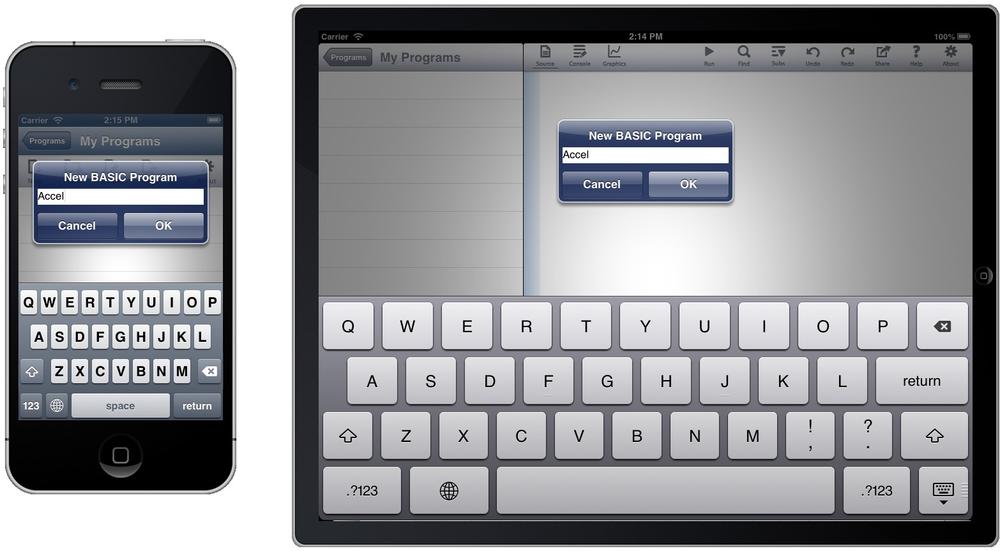
Enter Accel and tap OK. This creates a new, empty program. Enter the source code from our first program:
PRINT Sensors.accel
You should see something like what’s shown in Figure 1-5.
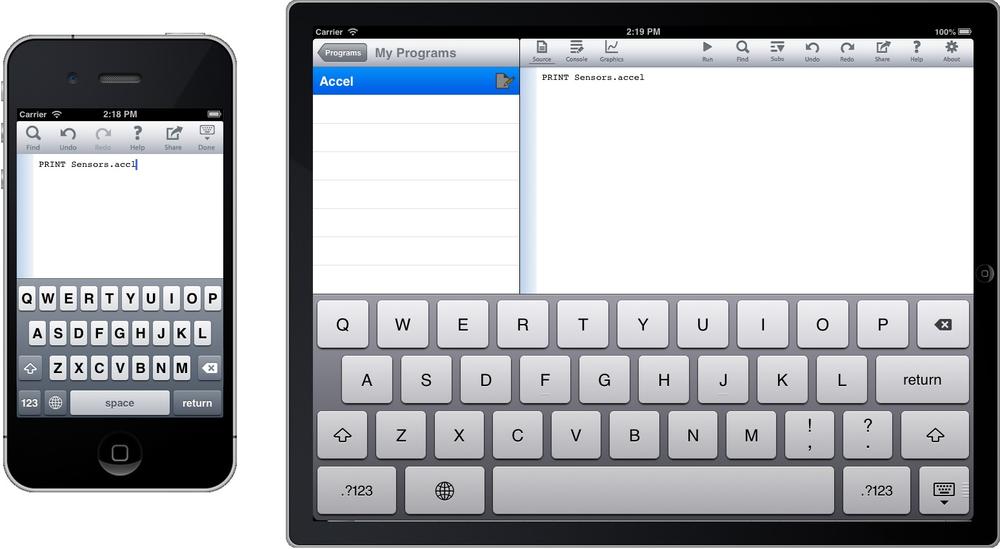
If you’re on an iPhone, you will need to dismiss the keyboard by tapping the Dismiss Keyboard button, then navigate back to the program list by tapping the Programs button. The Dismiss Keyboard button is the button at the top right that looks like a little keyboard with a triangle under it. You can dismiss the keyboard on the iPad, too, but it’s optional.
Now tap the name of the program. On the iPad, you can also tap the Run button on the button bar. The screen will shift automatically to the console, which is the display that shows text input and output. Here’s what I saw on my iPad when I ran the program:
-0.912109 -2.288818E-04 -0.394318 80395.372433
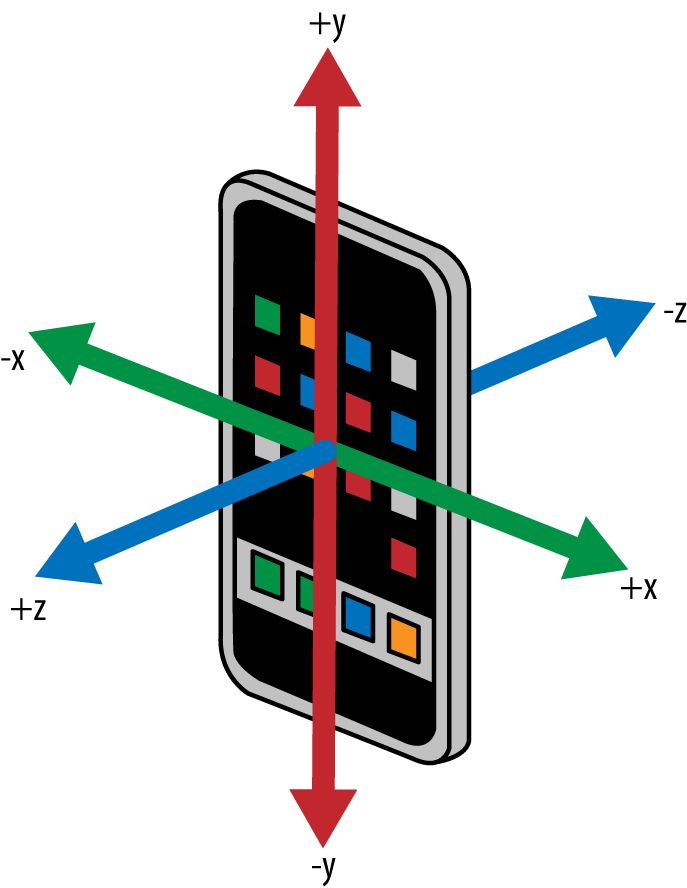
Acceleration is measured in units of gravities. These numbers show I was using my iPad in portrait mode, with the home button to the right. The acceleration along the x-axis is nearly –1, indicating that the left edge of the iPad was down. Apparently my desk is just about perfectly level, because acceleration along the y-axis was zero to three decimal places. The iPad was tipped back slightly on a folding stand, so the z acceleration was slightly negative. Figure 1-6 shows the coordinate system used by iPhone and iPad sensors. The time code doesn’t tell you the actual time, just the number of seconds that have elapsed since some arbitrary time.
Run the program a few times, holding the iPhone or iPad in various orientations. You’ll clearly see the sensor readings change.
The Accelerometer
While the simple program to read the accelerometer certainly does the job, we want something a bit more sophisticated. Our next program, seen in Figure 1-7, will read the accelerometer continuously, plotting the acceleration along each of the three axes on an oscilloscope-like display. Pressing the Record button records the data, writing it to a datafile that we can then read in other programs for subsequent processing. Of course, we may want to share the data or analyze it from another computer, so the Send button will send the most recent datafile to another device as an email attachment.
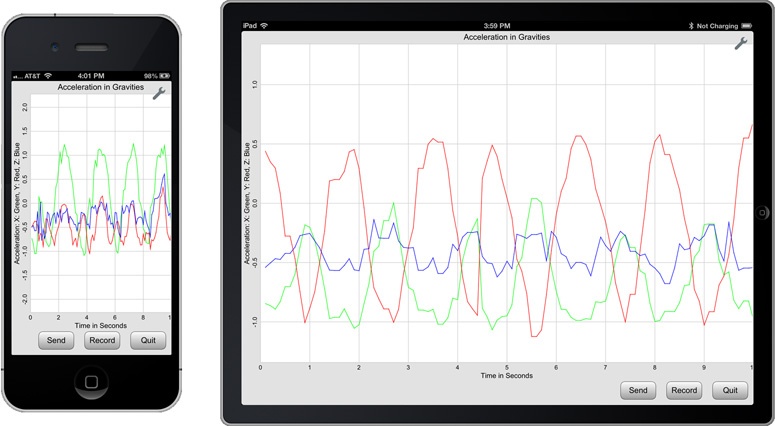
Like all plots in techBASIC, this one can be resized and panned. Swipe up or down to see higher or lower values along the y-axis, or pinch vertically to see a wider range or to zoom in. techBASIC normally supports a few other features, like panning along the x-axis or tapping to see the value of a point on the plot, but these have been disabled, since they aren’t necessary in this program.
Before we look at the source code, give the program a try to get familiar with it. Navigate to the O’Reilly Books folder and run the Accelerometer program. Be sure to record some data and email it to yourself. Try the swipe and pinch gestures to see how they work. Knowing how the program works will help as we dig through the source code.
Note
This program is a sample in techBASIC and techBASIC Sampler, so there is no need to type it in. Look for the program called Accelerometer in the O’Reilly Books folder.
Now that you have taken a moment to run the program and see what it does, let’s dive in and see how it works. We’ll break the program up into bite-sized pieces and explore how each piece works. Here’s the first chunk, which you will see right at the top of the full program listing:
! Shows a running plot of the acceleration for the last 10
! seconds in 0.1-second intervals. Supports recording the
! values and emailing the results.

! Create the plots and arrays to hold the plot points.
DIM p as Plot, px as PlotPoint, py as PlotPoint, pz as PlotPoint
DIM ax(100, 2), ay(100, 2), az(100, 2)
The lines that start with an exclamation point are comments. They don’t do anything; they exist solely so we can understand the program later.
The program shows the acceleration using three point plots that are shown on a single set of axes. The overall image is called a Plot in techBASIC, and a PlotPoint object handles each of the three point plots. These will be used in several places in the program, so they are defined in a DIM statement at the start of the program. The points that actually show up on the plot are stored in two-dimensional arrays; each array has 100 x, y pairs. These are defined in a second DIM statement.
! Create the controls.
DIM quit AS Button, record AS Button, send AS Button
The three buttons that appear at the bottom of the screen are defined next. Each will be a Button object.
! Create and initialize the global tracking variables. fileName$ = "tempdata.txt"recording = 0
index = 1
! Get and set an initial time for the accelerometer. DIM t0 AS DOUBLE
a = Sensors.accel t0 = a(4)
There are several variables that will be used in multiple places as the program runs, so these are initialized next:
-
filename$holds the name of the file used to store acceleration data when it is recorded. It could be hardcoded in each place it is used, but placing it here makes it easy for you to change the filename if you would like to use some other name.-
recordingis a flag used to indicate if the accelerometer data is being recorded or just displayed on the plot. The program will set this value to1whenever it is recording data.-
The program sweeps across the plot, replacing the oldest accelerometer reading with the most recent one.
indexis used to keep track of the next location where an acceleration value will be recorded. Setting it to1tells the program to start at the leftmost point on the plot.-
As you will see in a moment, the program will use a timer to tell when new accelerometer data is available, as well as when it was actually recorded by the accelerometer.
t0is used to keep track of the time of the last accelerometer reading. It’s actually initialized by taking an initial accelerometer reading, recording the time, and throwing away the acceleration values.
With all of the variables declared and initialized, the program calls a subroutine to set up the user interface.
! Create the user interface.
setUpGUI
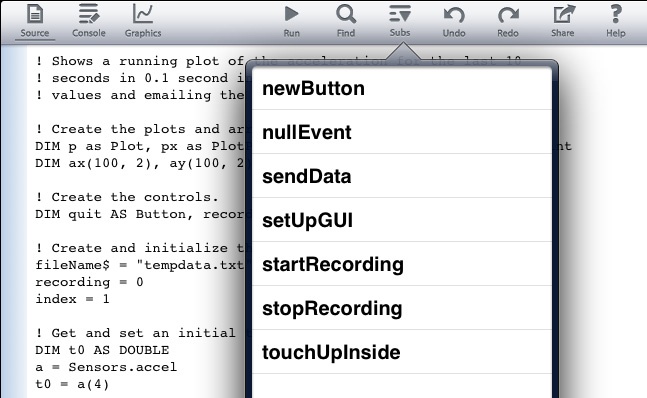
If you glance at the complete source code for the program, you will see that the rest of the program is a collection of subroutines. On the iPad, you can see a list of the subroutines by tapping the Subs button shown in Figure 1-8. Setting up the user interface is the last thing the program does. The reason it doesn’t just stop at this point is that it’s an event-driven program. Two subroutines that handle events appear in the code. The program will continue to run, processing these events indefinitely, until we stop it. Since the program takes over the full screen, the obvious way to stop it is using the Quit button.
There actually is another way to stop the program, though. Did you notice the small tool icon at the top right of the graphics screen? Tap this button and a menu of choices will show up, as shown in Figure 1-9.
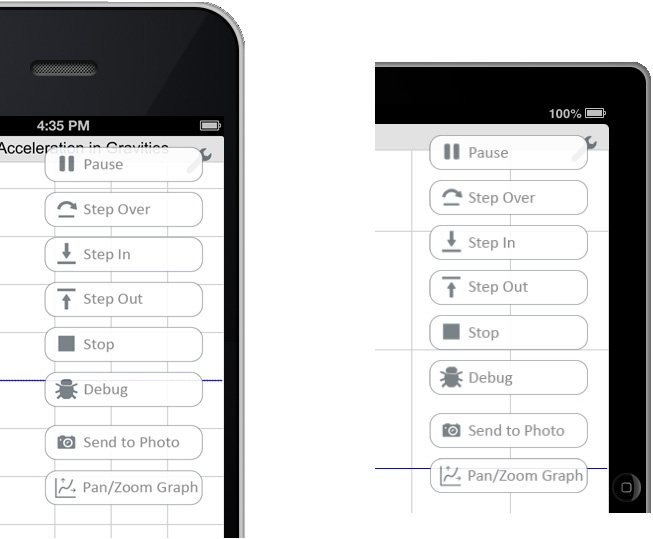
One of the options is Stop. You can use this to stop a program you are working on, even if it has a bug that prevents the Quit button from working. There are several other options that give you access to the step-and-trace debugger, making it easier to find those pesky digital arthropods. See the techBASIC Quick Start Guides or Reference Manual for a quick but complete introduction to the debugger.
There are lots of subroutines to look at. Let’s start with the one that creates the user interface. From the iPhone, scroll down or use the Find button to search for the subroutine. From the iPad, tap the Subs button to get a list of subroutines, then tap setUpGUI to jump right to that subroutine.
! Set up the user interface.

SUB setUpGUI
! Tell the accelerometer to update once every 0.05 seconds.
sensors.setAccelRate(0.05)
In theory, the accelerometer can take readings at a speed of up to about 100 samples per second. It won’t be able to do it that quickly while we continuously update a plot, though. It also rarely records that fast even when a program is doing nothing but gathering accelerometer data. In any case, we’re going to create a 10-second plot with 100 points, so we only need a new value about once every tenth of a second. It turns out that the accelerometer software in the operating system considers the data rate we specify to be a hint, not a commitment, and the data will come back at time intervals that don’t exactly match the time we ask for. We’ll ask for the data about twice as fast as we really need it, one point every 0.05 seconds, to make it more likely that we’ll get a new value at least once every tenth of a second.
Why not just ask for it as fast as we can get it? Sensors use a fair amount of battery power, and they use more power at faster sampling rates. Only asking for the data we need saves the device’s battery.
! Initialize the plot arrays.
FOR t = 1 TO 100
  ax(t, 1) = t/10.0
  ay(t, 1) = t/10.0
  az(t, 1) = t/10.0
NEXT
The three point plots each contain 100 x, y pairs used to locate the point that will be plotted on the screen. The y values will be set by the accelerometer as the program runs. The x values don’t change—the program simply updates the y values as needed. These lines set the x values for each of the points to evenly distribute them across the plot. It uses values from 0.1 to 10.0, corresponding to the time value shown on the x-axis of the plot.
! Initialize the plot and show it.
p = Graphics.newPlot
The first step in creating the plot is to create the plot object that defines the axes. The variable p used to hold the Plot object was declared earlier in the program, but the plot doesn’t exist until this line is executed.
p.setTitle("Acceleration in Gravities")
p.setXAxisLabel("Time in Seconds")
p.setYAxisLabel("Acceleration: X: Green, Y: Red, Z: Blue")
p.showGrid(1)
p.setGridColor(0.8, 0.8, 0.8)
Now that the plot exists, we can make it pretty, adding labels and creating a nice grid for a background.
p.setAllowedGestures($0042)
techBASIC supports a number of gestures to manipulate plots. For two-dimensional plots, swiping moves a plot around, pinching zooms in or out, and tapping shows the coordinates of a point on the plot. Since the horizontal axis is fixed and the points are constantly updating, most of these gestures are inappropriate in this program. This line turns all of them off except pinching and translation along the y-axis.
px = p.newPlot(ax)
px.setColor(0, 1, 0)
px.setPointColor(0, 1, 0)
These lines create the first of the three point plots. The first line creates the PlotPoint object, saving it in the global variable px. The next two set the color of the connecting lines and points to green. This is the plot that will show acceleration along the x-axis, which is the horizontal axis as the iPhone or iPad is held with the home button down.
py = p.newPlot(ay)
py.setColor(1, 0, 0)
py.setPointColor(1, 0, 0)

pz = p.newPlot(az)
pz.setColor(0, 0, 1)
pz.setPointColor(0, 0, 1)
Here we do the same thing for the y- and x-axes, coloring the plots red and blue.
! Set the plot range and domain. This must be done
! after adding the first PlotPoint, since that also
! sets the range and domain.
p.setView(0, -2, 10, 2, 0)
Plots default to show the points in the first equation or set of points plotted. This line sets the view to show ±2G for 10 seconds.
! Show the graphics screen. Pass 1 as the parameter
! for full-screen mode.
system.showGraphics(1)
Now that almost everything is set up, the program switches to the graphics screen. Passing a 1 for the last parameter tells techBASIC to hide the development environment, using the full screen for the program.
! Lock the screen in the current orientation.
orientation = 1 << (System.orientation - 1)
System.setAllowedOrientations(orientation)
This is an accelerometer, and we expect anyone using it to bounce the iPhone about, turn it, and so forth. The iPhone normally responds to this by changing the screen orientation. There are two reasons we don’t want that default behavior. The first is that it actually takes quite a bit of time for iOS to recreate the screen in a new orientation, and we don’t want to lose any data while it’s working. The second is that it’s ugly.
These lines look to see what orientation the device is in when the app starts, and locks it into that orientation.
! Set the plot size.
p.setRect(0, 0, Graphics.width, Graphics.height - 47)
The default size for a plot is to fill the screen. We need room at the bottom for the buttons, so we manually set the size of the plot to leave 47 pixels at the bottom of the screen.
! Draw the background.
Graphics.setPixelGraphics(0)
Graphics.setColor(0.886, 0.886, 0.886)
Graphics.fillRect(0, 0, Graphics.width, Graphics.height)
That area at the bottom of the screen starts off white. This paints it the same light gray used for the background of the plot.
! Set up the user interface.
h = Graphics.height - 47
quit = newButton(Graphics.width - 82, h, "Quit")
record = newButton(Graphics.width - 174, h, "Record")
send = newButton(Graphics.width - 266, h, "Send")
Here we call a subroutine to create the three buttons at the bottom of the screen.
! If there is nothing to send, disable the Send button.
IF NOT EXISTS(fileName$) THEN
  send.setEnabled(0)
END IF
END SUB
We can’t send the datafile in an email if it doesn’t exist. If there isn’t already a datafile from a previous run, setEnabled(0) disables the Send button so the users know it can’t be used and don’t think our program is broken when they tap the button and it does nothing.
Well, some of them will think it’s broken, anyway. That’s users for you. But at least we made an effort.
! Creates a new button with a gradient fill.
!
! Parameters:
!    x - Horizontal location.
!    y - Vertical location.
!    title - Name of the button.
!
! Returns: The new button.

FUNCTION newButton (x, y, title AS STRING) AS Button
DIM b AS Button
b = Graphics.newButton(x, y)
b.setTitle(title)
b.setBackgroundColor(1, 1, 1)
b.setGradientColor(0.6, 0.6, 0.6)
newButton = b
END FUNCTION
The subroutine that set up the user interface called this one to do the grunt work of creating a button. That’s because there are several tasks that would have been repeated three times. It also makes the program easier to change. If you decide you want blue buttons, you just need to change the color once and all of the buttons will be updated.
The first part should look familiar, even though you haven’t seen the program create a button yet. The button is declared with a DIM statement and created with a newButton call, and the title is set using setTitle.
The next two lines are the ones that give the nice gradient fill on the button, a small but professional touch that adds a lot to the overall impression people get when looking at a program. The lines vary the button color from white to a medium gray. There are lots of other options in techBASIC, like changing the angle of the gradient, but this simple gradient looks nice and is easy to create.
Finally, the newly created button is returned to the caller, where the setUpGUI subroutine stores it in the appropriate variable.
At this point we have a complete program, but if you were to run it, it would stop without doing anything interesting. It’s time to tell techBASIC that we want some events.
! Handle a tap on one of the buttons. ! ! Parameters: ! ctrl - The button that was tapped. ! time - The time when the event occurred. SUB touchUpInside (ctrl AS Button, time AS DOUBLE) IF ctrl = quit THEN
Simply creating a subroutine with the name touchUpInside and this parameter list turns the program into an event-driven program. It will run until deliberately stopped, waiting for the user to tap on a button. When a button is finally tapped, this subroutine is called. It gets the button object, which we can use to figure out which of the three buttons was pressed, and the time when the button was tapped.
-
The
IFstatement checks to see which button was tapped, comparing the parameter to the variables holding the three buttons. There are other ways to detect which button was pressed, but this one is easy to implement and understand.-
For the Quit button, the program stops any recording that might be in progress by calling
stopRecording, then stops the program.-
The Record button actually does two different things. If the program is not recording the acceleration data, it starts; if the program is already recording acceleration data, it stops.
-
Finally, the Send button stops any recording that might be in progress, then calls yet another subroutine to create an email and send the data.
All of the interesting stuff is happening in subroutines. Here’s the first:
! Called when the program should start recording
! data, this subroutine changes the name of the
! recording button to Stop, opens the output file,
! and sets a flag indicating data should be
! recorded.

SUB startRecording
record.setTitle("Stop")
recording = 1
OPEN fileName$ FOR OUTPUT AS #1
END SUB
The record button does double duty, functioning both as a Record and a Stop button. This saves space, which is really at a premium on the iPhone, and also makes the program a little easier to write and perhaps a little easier to use by not showing and handling a lot of disabled buttons. The startRecording subroutine is called to start a recording. The user needs a way to stop it, too, so when the button is pressed one of the things the code does is change the name of the button to Stop.
We still haven’t gotten to the code that actually reads the accelerometer, but when we do, it will need to know if it is supposed to record to the data file, or just draw what it reads on the plot. Setting recording to 1 is our signal to do both.
Finally, if we’re going to write stuff to a file, we need to open the file. The OPEN command opens a file for output.
! Called to stop recording data, this subroutine
! changes the name of the recording button to
! Recording, clears the recording flag and closes
! the output file.
!
! It is safe to call this subroutine even if
! nothing is being recorded.

SUB stopRecording
IF recording THEN
  record.setTitle("Record")
  CLOSE #1
  recording = 0
  send.setEnabled(1)
END IF
END SUB
The stopRecording subroutine undoes all of the actions taken by the startRecording subroutine. The only finesse is that it checks to make sure a recording is in progress before stopping it. That makes the program logic easier back in touchUpInside, as it means the code to handle the Quit and Send buttons doesn’t have to check to see if a recording is in progress. Instead, it can just call the subroutine, knowing that if a recording is in progress it will be stopped, but that it’s safe to call the subroutine even if the program isn’t recording the acceleration data.
! Send the last recorded data file to an email.

SUB sendData
DIM e AS eMail
e = System.newEMail
IF e.canSendMail THEN
  e.setSubject("Accelerometer data")
  e.setMessage("Accelerometer data")
  e.addAttachment(fileName$, "text/plain")
  e.send
ELSE
  button = Graphics.showAlert("Can't Send", _
     "Email cannot be sent from this device.")
END IF
END SUB
The code in touchUpInside that handles the Send button calls this subroutine to do the work. It defines and initializes the email object.
Not all iOS devices can actually send an email. Some may have the capability turned off, for example. The program starts by checking to see if it’s possible to send an email, showing an alert if not.
If email is supported, it’s a simple matter to attach the datafile, create a short subject and message, and send it. As you saw when you tried the program, pressing Send doesn’t actually send the email, it just gets it ready and presents the mail message to the user. This gives the user a chance to address the email and send it manually.
It might seem nice if you could skip that step, addressing the email and sending it without user interaction. Apple blocks that action, though, and I think appropriately so; this ensures that rogue programs cannot collect and send information without the user’s knowledge.
! Called when nothing else is happening, this
! subroutine checks to see if 0.1 seconds have
! elapsed since the last sensor reading. If so, a
! new one is recorded and displayed.
!
! Parameters:
!    time - The time when the event occurred.

SUB nullEvent (time AS DOUBLE)
a = Sensors.accel
The final subroutine is the one that actually collects and handles the acceleration data. This subroutine is called nullEvent. techBASIC calls it any time it is not busy doing something else, which in this program means any time except when a tap on a button is being handled. The subroutine starts by grabbing the most recent accelerometer value.
IF recording AND (t0 <> a(4)) THEN
  PRINT #1, a(1); ","; a(2); ","; a(3); ","; a(4)
END IF
Because this subroutine can be called pretty rapidly—more often than we’ve asked the accelerometer to collect acceleration information—we need to check to see if the timestamp has changed since the last reading. If not, we’ve already handled this value and don’t need to do so again. We also check to see if the program is supposed to save the acceleration data in the output file. If both conditions are met, the value from the accelerometer is written to the file.
The four numbers are separated by commas, and each reading is placed on a separate line. This is the so-called comma-separated values, or CSV, file format. It’s extremely common, and a very easy format to write and read in BASIC. It’s also a format that most spreadsheets and databases can read and write, so using it makes it easy to process the accelerometer data offline.
IF a(4) > t0 + 0.1 THEN
  WHILE a(4) > t0 + 0.1
    t0 = t0 + 0.1
    ax(index, 2) = a(1)
    ay(index, 2) = a(2)
    az(index, 2) = a(3)
    index = index + 1
    IF index > 100 THEN index = 1
  WEND
  px.setPoints(ax)
  py.setPoints(ay)
  pz.setPoints(az)
END IF
END SUB
The last section of the subroutine checks to see if at least one-tenth of a second has elapsed since the last value was placed in the plot. If so, it places the reading in the array holding the points to plot. Critically, it then loops to see if it needs to place the same point in again. This could happen if iOS was busy doing something else and didn’t record a value for, say, a quarter of a second.
Finally, the arrays are passed to the various point plots using the setPoints method. This is where the plot actually gets updated.
As you’ve seen, almost all of the work is in creating and handling the user interface. There is a lot to creating a pleasant, usable user interface, so the program is a bit involved, but the effect is worth it.
We’re also going to reuse most of the code for our next two programs!
Get Building iPhone and iPad Electronic Projects now with the O’Reilly learning platform.
O’Reilly members experience books, live events, courses curated by job role, and more from O’Reilly and nearly 200 top publishers.

