All modern browsers have a debugger built into them. Firefox has Firebug and Chrome has Chrome DevTools:
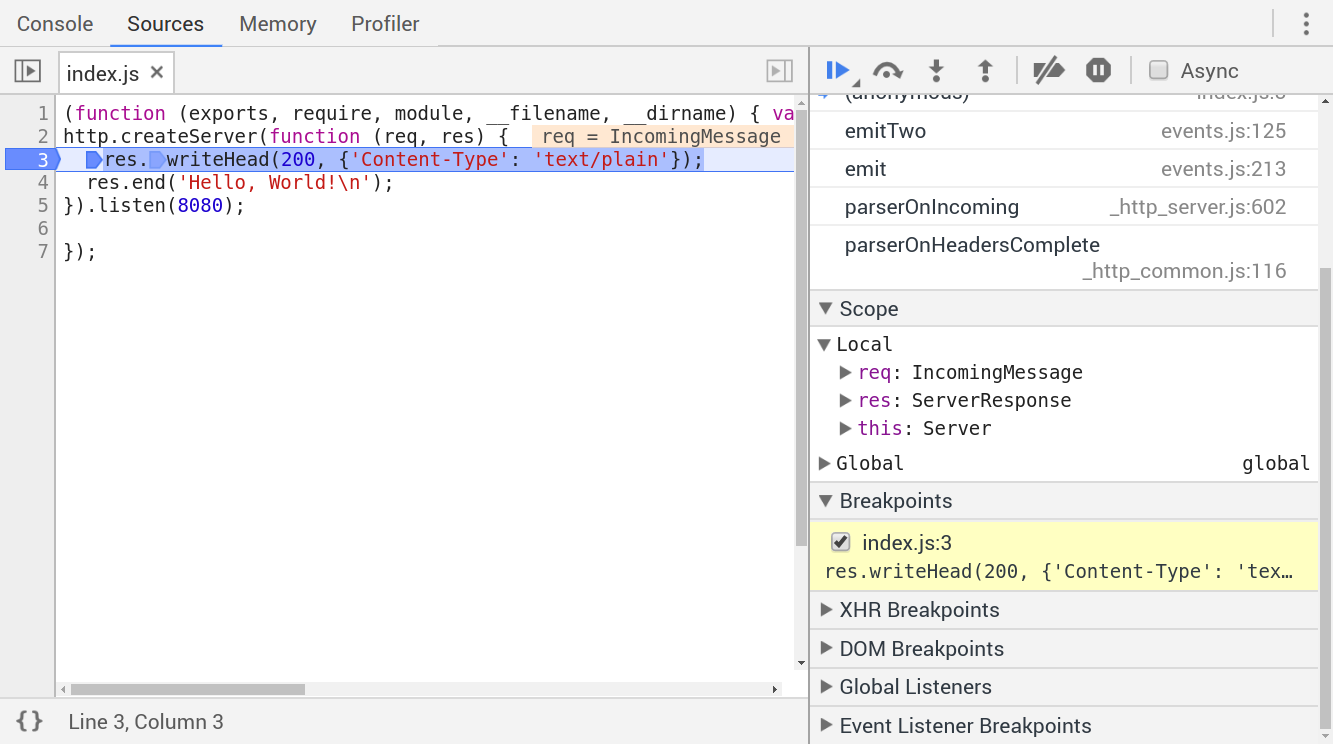
The debugger in Chrome is available under the Sources tab of Chrome DevTools. We've set a breakpoint on line 3 and our script has paused there. While it is paused, we can access variables within the scope, which include local and global scope, as well as scope available due to closures. It also lists out all our breakpoints so we can activate/deactivate them easily.
To use Chrome DevTools for Node.js debugging, simply pass in the --inspect flag when you run node, then navigate to chrome://inspect/#devices in Chrome, ...

