16.4. Using Regression on Excel
Spreadsheet programs such as Excel have an easy-to-use regression routine.
To utilize Excel for regression analysis, three steps need to be followed:
Click the Tools menu.
Click Add-Ins.
Click Analysis ToolPak. (If Analysis ToolPak is not listed as an available add-in, exit Excel, double-click the MS Excel setup icon, click Add/Remove, double-click Add-ins, and select Analysis ToolPak. Then restart Excel and repeat the above instruction.)
After ensuring that the Analysis ToolPak is available, access the regression tool by completing these three steps:
Click the Tools menu.
Click Data Analysis.
Click Regression.
Exhibit 16.4 captures the regression input dialog screen.
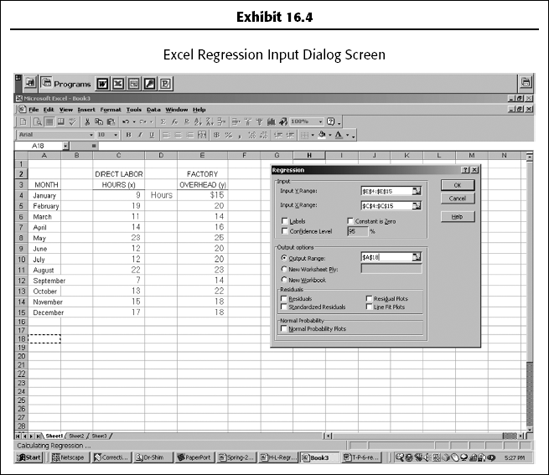
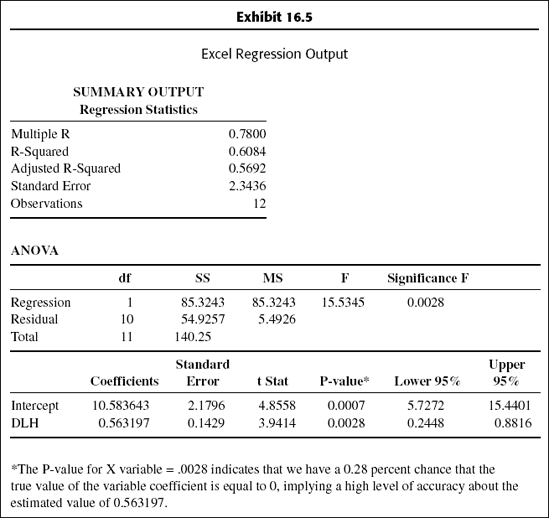
Exhibit 16.5 shows an Excel regression output that contains the statistics discussed so far.
NOTE
To obtain a scattergraph, use Excel's Chart Wizard.
The result shows:
- Y′ =10.5836 + 0.563197X (in the form of Y′ = a + bX)
with R-squared (R2)= 0.608373 = 60.84%
All of the above are the same as the ones manually obtained.
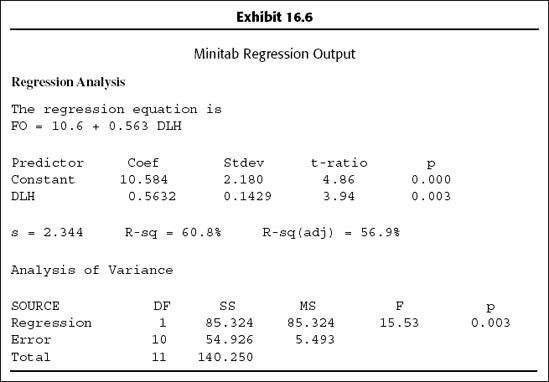
Exhibit 16.6 is the regression output from popular statistical software Minitab.
Get Budgeting Basics and Beyond now with the O’Reilly learning platform.
O’Reilly members experience books, live events, courses curated by job role, and more from O’Reilly and nearly 200 top publishers.

