Chapter 21. Presenting Different Views of the Same Data
A report can often be more effective when it highlights and reinforces key information. A common design technique is to present key data in both graphical and textual formats. Compare the reports in Figure 21-1.
Figure 21-1. Comparison of reports displaying summary data in different formats
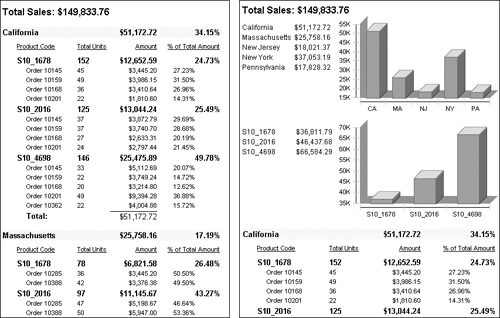
The report on the left shows the first page of a report that displays detailed sales data. Totals and percentages for each state are displayed prominently in each state group header, but it is difficult to compare the aggregate data among the states because the data appears on multiple pages.
The report ...
Get BIRT: A Field Guide, Third Edition now with the O’Reilly learning platform.
O’Reilly members experience books, live events, courses curated by job role, and more from O’Reilly and nearly 200 top publishers.

