The future belongs to the companies and people that turn data into products.
Weâve all heard it: according to Hal Varian, statistics is the next sexy job. Five years ago, in What is Web 2.0, Tim OâReilly said that âdata is the next Intel Inside.â But what does that statement mean? Why do we suddenly care about statistics and about data?
In this post, I examine the many sides of data scienceâthe technologies, the companies and the unique skill sets.
The web is full of âdata-driven apps.â Almost any e-commerce application is a data-driven application. Thereâs a database behind a web front end, and middleware that talks to a number of other databases and data services (credit card processing companies, banks, and so on). But merely using data isnât really what we mean by âdata science.â A data application acquires its value from the data itself, and creates more data as a result. Itâs not just an application with data; itâs a data product. Data science enables the creation of data products.
One of the earlier data products on the Web was the CDDB database. The developers of CDDB realized that any CD had a unique signature, based on the exact length (in samples) of each track on the CD. Gracenote built a database of track lengths, and coupled it to a database of album metadata (track titles, artists, album titles). If youâve ever used iTunes to rip a CD, youâve taken advantage of this database. Before it does anything else, iTunes reads the length of every track, sends it to CDDB, and gets back the track titles. If you have a CD thatâs not in the database (including a CD youâve made yourself), you can create an entry for an unknown album. While this sounds simple enough, itâs revolutionary: CDDB views music as data, not as audio, and creates new value in doing so. Their business is fundamentally different from selling music, sharing music, or analyzing musical tastes (though these can also be âdata productsâ). CDDB arises entirely from viewing a musical problem as a data problem.
Google is a master at creating data products. Hereâs a few examples:
Googleâs breakthrough was realizing that a search engine could use input other than the text on the page. Googleâs PageRank algorithm was among the first to use data outside of the page itself, in particular, the number of links pointing to a page. Tracking links made Google searches much more useful, and PageRank has been a key ingredient to the companyâs success.
Spell checking isnât a terribly difficult problem, but by suggesting corrections to misspelled searches, and observing what the user clicks in response, Google made it much more accurate. Theyâve built a dictionary of common misspellings, their corrections, and the contexts in which they occur.
Speech recognition has always been a hard problem, and it remains difficult. But Google has made huge strides by using the voice data theyâve collected, and has been able to integrate voice search into their core search engine.
During the Swine Flu epidemic of 2009, Google was able to track the progress of the epidemic by following searches for flu-related topics.

Google isnât the only company that knows how to use data. Facebook and LinkedIn use patterns of friendship relationships to suggest other people you may know, or should know, with sometimes frightening accuracy. Amazon saves your searches, correlates what you search for with what other users search for, and uses it to create surprisingly appropriate recommendations. These recommendations are âdata productsâ that help to drive Amazonâs more traditional retail business. They come about because Amazon understands that a book isnât just a book, a camera isnât just a camera, and a customer isnât just a customer; customers generate a trail of âdata exhaustâ that can be mined and put to use, and a camera is a cloud of data that can be correlated with the customersâ behavior, the data they leave every time they visit the site.
The thread that ties most of these applications together is that data collected from users provides added value. Whether that data is search terms, voice samples, or product reviews, the users are in a feedback loop in which they contribute to the products they use. Thatâs the beginning of data science.
In the last few years, there has been an explosion in the amount of data thatâs available. Whether weâre talking about web server logs, tweet streams, online transaction records, âcitizen science,â data from sensors, government data, or some other source, the problem isnât finding data, itâs figuring out what to do with it. And itâs not just companies using their own data, or the data contributed by their users. Itâs increasingly common to mashup data from a number of sources. âData Mashups in Râ analyzes mortgage foreclosures in Philadelphia County by taking a public report from the county sheriffâs office, extracting addresses and using Yahoo to convert the addresses to latitude and longitude, then using the geographical data to place the foreclosures on a map (another data source), and group them by neighborhood, valuation, neighborhood per-capita income, and other socio-economic factors.
The question facing every company today, every startup, every non-profit, every project site that wants to attract a community, is how to use data effectivelyânot just their own data, but all the data thatâs available and relevant. Using data effectively requires something different from traditional statistics, where actuaries in business suits perform arcane but fairly well-defined kinds of analysis. What differentiates data science from statistics is that data science is a holistic approach. Weâre increasingly finding data in the wild, and data scientists are involved with gathering data, massaging it into a tractable form, making it tell its story, and presenting that story to others.
To get a sense for what skills are required, letâs look at the data lifecycle: where it comes from, how you use it, and where it goes.
Data is everywhere: your government, your web server, your business partners, even your body. While we arenât drowning in a sea of data, weâre finding that almost everything can (or has) been instrumented. At OâReilly, we frequently combine publishing industry data from Nielsen BookScan with our own sales data, publicly available Amazon data, and even job data to see whatâs happening in the publishing industry. Sites like Infochimps and Factual provide access to many large datasets, including climate data, MySpace activity streams, and game logs from sporting events. Factual enlists users to update and improve its datasets, which cover topics as diverse as endocrinologists to hiking trails.
Much of the data we currently work with is the direct consequence of Web 2.0, and of Mooreâs Law applied to data. The web has people spending more time online, and leaving a trail of data wherever they go. Mobile applications leave an even richer data trail, since many of them are annotated with geolocation, or involve video or audio, all of which can be mined. Point-of-sale devices and frequent-shopperâs cards make it possible to capture all of your retail transactions, not just the ones you make online. All of this data would be useless if we couldnât store it, and thatâs where Mooreâs Law comes in. Since the early â80s, processor speed has increased from 10 MHz to 3.6 GHzâan increase of 360 (not counting increases in word length and number of cores). But weâve seen much bigger increases in storage capacity, on every level. RAM has moved from $1,000/MB to roughly $25/GBâa price reduction of about 40000, to say nothing of the reduction in size and increase in speed. Hitachi made the first gigabyte disk drives in 1982, weighing in at roughly 250 pounds; now terabyte drives are consumer equipment, and a 32 GB microSD card weighs about half a gram. Whether you look at bits per gram, bits per dollar, or raw capacity, storage has more than kept pace with the increase of CPU speed.
1956 disk drive

One of the first commercial disk drives from IBM. It has a 5 MB capacity and itâs stored in a cabinet roughly the size of a luxury refrigerator. In contrast, a 32 GB microSD card measures around 5/8 x 3/8 inch and weighs about 0.5 gram.
Photo: Mike Loukides. Disk drive on display at IBM Almaden Research
The importance of Mooreâs law as applied to data isnât just geek pyrotechnics. Data expands to fill the space you have to store it. The more storage is available, the more data you will find to put into it. The data exhaust you leave behind whenever you surf the web, friend someone on Facebook, or make a purchase in your local supermarket, is all carefully collected and analyzed. Increased storage capacity demands increased sophistication in the analysis and use of that data. Thatâs the foundation of data science.
So, how do we make that data useful? The first step of any data analysis project is âdata conditioning,â or getting data into a state where itâs usable. We are seeing more data in formats that are easier to consume: Atom data feeds, web services, microformats, and other newer technologies provide data in formats thatâs directly machine-consumable. But old-style screen scraping hasnât died, and isnât going to die. Many sources of âwild dataâ are extremely messy. They arenât well-behaved XML files with all the metadata nicely in place. The foreclosure data used in âData Mashups in Râ was posted on a public website by the Philadelphia county sheriffâs office. This data was presented as an HTML file that was probably generated automatically from a spreadsheet. If youâve ever seen the HTML thatâs generated by Excel, you know thatâs going to be fun to process.
Data conditioning can involve cleaning up messy HTML with tools like Beautiful Soup, natural language processing to parse plain text in English and other languages, or even getting humans to do the dirty work. Youâre likely to be dealing with an array of data sources, all in different forms. It would be nice if there was a standard set of tools to do the job, but there isnât. To do data conditioning, you have to be ready for whatever comes, and be willing to use anything from ancient Unix utilities such as awk to XML parsers and machine learning libraries. Scripting languages, such as Perl and Python, are essential.
Once youâve parsed the data, you can start thinking about the quality of your data. Data is frequently missing or incongruous. If data is missing, do you simply ignore the missing points? That isnât always possible. If data is incongruous, do you decide that something is wrong with badly behaved data (after all, equipment fails), or that the incongruous data is telling its own story, which may be more interesting? Itâs reported that the discovery of ozone layer depletion was delayed because automated data collection tools discarded readings that were too low[1]. In data science, what you have is frequently all youâre going to get. Itâs usually impossible to get âbetterâ data, and you have no alternative but to work with the data at hand.
If the problem involves human language, understanding the data adds another dimension to the problem. Roger Magoulas, who runs the data analysis group at OâReilly, was recently searching a database for Apple job listings requiring geolocation skills. While that sounds like a simple task, the trick was disambiguating âAppleâ from many job postings in the growing Apple industry. To do it well you need to understand the grammatical structure of a job posting; you need to be able to parse the English. And that problem is showing up more and more frequently. Try using Google Trends to figure out whatâs happening with the Cassandra database or the Python language, and youâll get a sense of the problem. Google has indexed many, many websites about large snakes. Disambiguation is never an easy task, but tools like the Natural Language Toolkit library can make it simpler.
When natural language processing fails, you can replace artificial intelligence with human intelligence. Thatâs where services like Amazonâs Mechanical Turk come in. If you can split your task up into a large number of subtasks that are easily described, you can use Mechanical Turkâs marketplace for cheap labor. For example, if youâre looking at job listings, and want to know which originated with Apple, you can have real people do the classification for roughly $0.01 each. If you have already reduced the set to 10,000 postings with the word âApple,â paying humans $0.01 to classify them only costs $100.
Weâve all heard a lot about âbig data,â but âbigâ is really a red herring. Oil companies, telecommunications companies, and other data-centric industries have had huge datasets for a long time. And as storage capacity continues to expand, todayâs âbigâ is certainly tomorrowâs âmediumâ and next weekâs âsmall.â The most meaningful definition Iâve heard: âbig dataâ is when the size of the data itself becomes part of the problem. Weâre discussing data problems ranging from gigabytes to petabytes of data. At some point, traditional techniques for working with data run out of steam.
What are we trying to do with data thatâs different? According to Jeff Hammerbacher[2] (@hackingdata), weâre trying to build information platforms or dataspaces. Information platforms are similar to traditional data warehouses, but different. They expose rich APIs, and are designed for exploring and understanding the data rather than for traditional analysis and reporting. They accept all data formats, including the most messy, and their schemas evolve as the understanding of the data changes.
Most of the organizations that have built data platforms have found it necessary to go beyond the relational database model. Traditional relational database systems stop being effective at this scale. Managing sharding and replication across a horde of database servers is difficult and slow. The need to define a schema in advance conflicts with reality of multiple, unstructured data sources, in which you may not know whatâs important until after youâve analyzed the data. Relational databases are designed for consistency, to support complex transactions that can easily be rolled back if any one of a complex set of operations fails. While rock-solid consistency is crucial to many applications, itâs not really necessary for the kind of analysis weâre discussing here. Do you really care if you have 1,010 or 1,012 Twitter followers? Precision has an allure, but in most data-driven applications outside of finance, that allure is deceptive. Most data analysis is comparative: if youâre asking whether sales to Northern Europe are increasing faster than sales to Southern Europe, you arenât concerned about the difference between 5.92 percent annual growth and 5.93 percent.
To store huge datasets effectively, weâve seen a new breed of databases appear. These are frequently called NoSQL databases, or Non-Relational databases, though neither term is very useful. They group together fundamentally dissimilar products by telling you what they arenât. Many of these databases are the logical descendants of Googleâs BigTable and Amazonâs Dynamo, and are designed to be distributed across many nodes, to provide âeventual consistencyâ but not absolute consistency, and to have very flexible schema. While there are two dozen or so products available (almost all of them open source), a few leaders have established themselves:
Cassandra: Developed at Facebook, in production use at Twitter, Rackspace, Reddit, and other large sites. Cassandra is designed for high performance, reliability, and automatic replication. It has a very flexible data model. A new startup, Riptano, provides commercial support.
HBase: Part of the Apache Hadoop project, and modelled on Googleâs BigTable. Suitable for extremely large databases (billions of rows, millions of columns), distributed across thousands of nodes. Along with Hadoop, commercial support is provided by Cloudera.
Storing data is only part of building a data platform, though. Data is only useful if you can do something with it, and enormous datasets present computational problems. Google popularized the MapReduce approach, which is basically a divide-and-conquer strategy for distributing an extremely large problem across an extremely large computing cluster. In the âmapâ stage, a programming task is divided into a number of identical subtasks, which are then distributed across many processors; the intermediate results are then combined by a single reduce task. In hindsight, MapReduce seems like an obvious solution to Googleâs biggest problem, creating large searches. Itâs easy to distribute a search across thousands of processors, and then combine the results into a single set of answers. Whatâs less obvious is that MapReduce has proven to be widely applicable to many large data problems, ranging from search to machine learning.
The most popular open source implementation of MapReduce is the Hadoop project. Yahooâs claim that they had built the worldâs largest production Hadoop application, with 10,000 cores running Linux, brought it onto center stage. Many of the key Hadoop developers have found a home at Cloudera, which provides commercial support. Amazonâs Elastic MapReduce makes it much easier to put Hadoop to work without investing in racks of Linux machines, by providing preconfigured Hadoop images for its EC2 clusters. You can allocate and de-allocate processors as needed, paying only for the time you use them.
Hadoop goes far beyond a simple MapReduce implementation (of which there are several); itâs the key component of a data platform. It incorporates HDFS, a distributed filesystem designed for the performance and reliability requirements of huge datasets; the HBase database; Hive, which lets developers explore Hadoop datasets using SQL-like queries; a high-level dataflow language called Pig; and other components. If anything can be called a one-stop information platform, Hadoop is it.
Hadoop has been instrumental in enabling âagileâ data analysis. In software development, âagile practicesâ are associated with faster product cycles, closer interaction between developers and consumers, and testing. Traditional data analysis has been hampered by extremely long turn-around times. If you start a calculation, it might not finish for hours, or even days. But Hadoop (and particularly Elastic MapReduce) make it easy to build clusters that can perform computations on long datasets quickly. Faster computations make it easier to test different assumptions, different datasets, and different algorithms. Itâs easer to consult with clients to figure out whether youâre asking the right questions, and itâs possible to pursue intriguing possibilities that youâd otherwise have to drop for lack of time.
Hadoop is essentially a batch system, but Hadoop Online Prototype (HOP) is an experimental project that enables stream processing. Hadoop processes data as it arrives, and delivers intermediate results in (near) real-time. Near real-time data analysis enables features like trending topics on sites like Twitter. These features only require soft real-time; reports on trending topics donât require millisecond accuracy. As with the number of followers on Twitter, a âtrending topicsâ report only needs to be current to within five minutesâor even an hour. According to Hilary Mason (@hmason), data scientist at bit.ly, itâs possible to precompute much of the calculation, then use one of the experiments in real-time MapReduce to get presentable results.
Machine learning is another essential tool for the data scientist. We now expect web and mobile applications to incorporate recommendation engines, and building a recommendation engine is a quintessential artificial intelligence problem. You donât have to look at many modern web applications to see classification, error detection, image matching (behind Google Goggles and SnapTell) and even face detectionâan ill-advised mobile application lets you take someoneâs picture with a cell phone, and look up that personâs identity using photos available online. Andrew Ngâs Machine Learning course is one of the most popular courses in computer science at Stanford, with hundreds of students (this video is highly recommended).
There are many libraries available for machine learning: PyBrain in Python, Elefant, Weka in Java, and Mahout (coupled to Hadoop). Google has just announced their Prediction API, which exposes their machine learning algorithms for public use via a RESTful interface. For computer vision, the OpenCV library is a de-facto standard.
Mechanical Turk is also an important part of the toolbox. Machine learning almost always requires a âtraining set,â or a significant body of known data with which to develop and tune the application. The Turk is an excellent way to develop training sets. Once youâve collected your training data (perhaps a large collection of public photos from Twitter), you can have humans classify them inexpensivelyâpossibly sorting them into categories, possibly drawing circles around faces, cars, or whatever interests you. Itâs an excellent way to classify a few thousand data points at a cost of a few cents each. Even a relatively large job only costs a few hundred dollars.
While I havenât stressed traditional statistics, building statistical models plays an important role in any data analysis. According to Mike Driscoll (@dataspora), statistics is the âgrammar of data science.â It is crucial to âmaking data speak coherently.â Weâve all heard the joke that eating pickles causes death, because everyone who dies has eaten pickles. That joke doesnât work if you understand what correlation means. More to the point, itâs easy to notice that one advertisement for R in a Nutshell generated 2 percent more conversions than another. But it takes statistics to know whether this difference is significant, or just a random fluctuation. Data science isnât just about the existence of data, or making guesses about what that data might mean; itâs about testing hypotheses and making sure that the conclusions youâre drawing from the data are valid. Statistics plays a role in everything from traditional business intelligence (BI) to understanding how Googleâs ad auctions work. Statistics has become a basic skill. It isnât superseded by newer techniques from machine learning and other disciplines; it complements them.
While there are many commercial statistical packages, the open source R languageâand its comprehensive package library, CRANâis an essential tool. Although R is an odd and quirky language, particularly to someone with a background in computer science, it comes close to providing âone stop shoppingâ for most statistical work. It has excellent graphics facilities; CRAN includes parsers for many kinds of data; and newer extensions extend R into distributed computing. If thereâs a single tool that provides an end-to-end solution for statistics work, R is it.
A picture may or may not be worth a thousand words, but a picture is certainly worth a thousand numbers. The problem with most data analysis algorithms is that they generate a set of numbers. To understand what the numbers mean, the stories they are really telling, you need to generate a graph. Edward Tufteâs Visual Display of Quantitative Information is the classic for data visualization, and a foundational text for anyone practicing data science. But thatâs not really what concerns us here. Visualization is crucial to each stage of the data scientist. According to Martin Wattenberg (@wattenberg, founder of Flowing Media), visualization is key to data conditioning: if you want to find out just how bad your data is, try plotting it. Visualization is also frequently the first step in analysis. Hilary Mason says that when she gets a new data set, she starts by making a dozen or more scatter plots, trying to get a sense of what might be interesting. Once youâve gotten some hints at what the data might be saying, you can follow it up with more detailed analysis.
There are many packages for plotting and presenting data. GnuPlot is very effective; R incorporates a fairly comprehensive graphics package; Casey Reasâ and Ben Fryâs Processing is the state of the art, particularly if you need to create animations that show how things change over time. At IBMâs Many Eyes, many of the visualizations are full-fledged interactive applications.
Nathan Yauâs FlowingData blog is a great place to look for creative visualizations. One of my favorites is this animation of the growth of Walmart over time. And this is one place where âartâ comes in: not just the aesthetics of the visualization itself, but how you understand it. Does it look like the spread of cancer throughout a body? Or the spread of a flu virus through a population? Making data tell its story isnât just a matter of presenting results; it involves making connections, then going back to other data sources to verify them. Does a successful retail chain spread like an epidemic, and if so, does that give us new insights into how economies work? Thatâs not a question we could even have asked a few years ago. There was insufficient computing power, the data was all locked up in proprietary sources, and the tools for working with the data were insufficient. Itâs the kind of question we now ask routinely.
Data science requires skills ranging from traditional computer science to mathematics to art. Describing the data science group he put together at Facebook (possibly the first data science group at a consumer-oriented web property), Jeff Hammerbacher said:
... on any given day, a team member could author a multistage processing pipeline in Python, design a hypothesis test, perform a regression analysis over data samples with R, design and implement an algorithm for some data-intensive product or service in Hadoop, or communicate the results of our analyses to other members of the organization[3]
Where do you find the people this versatile? According to DJ Patil, chief scientist at LinkedIn (@dpatil), the best data scientists tend to be âhard scientists,â particularly physicists, rather than computer science majors. Physicists have a strong mathematical background, computing skills, and come from a discipline in which survival depends on getting the most from the data. They have to think about the big picture, the big problem. When youâve just spent a lot of grant money generating data, you canât just throw the data out if it isnât as clean as youâd like. You have to make it tell its story. You need some creativity for when the story the data is telling isnât what you think itâs telling.
Scientists also know how to break large problems up into smaller problems. Patil described the process of creating the group recommendation feature at LinkedIn. It would have been easy to turn this into a high-ceremony development project that would take thousands of hours of developer time, plus thousands of hours of computing time to do massive correlations across LinkedInâs membership. But the process worked quite differently: it started out with a relatively small, simple program that looked at membersâ profiles and made recommendations accordingly. Asking things like, did you go to Cornell? Then you might like to join the Cornell Alumni group. It then branched out incrementally. In addition to looking at profiles, LinkedInâs data scientists started looking at events that members attended. Then at books members had in their libraries. The result was a valuable data product that analyzed a huge databaseâbut it was never conceived as such. It started small, and added value iteratively. It was an agile, flexible process that built toward its goal incrementally, rather than tackling a huge mountain of data all at once.
This is the heart of what Patil calls âdata jiujitsuââusing smaller auxiliary problems to solve a large, difficult problem that appears intractable. CDDB is a great example of data jiujitsu: identifying music by analyzing an audio stream directly is a very difficult problem (though not unsolvableâsee midomi, for example). But the CDDB staff used data creatively to solve a much more tractable problem that gave them the same result. Computing a signature based on track lengths, and then looking up that signature in a database, is trivially simple.
Hiring trends for data science
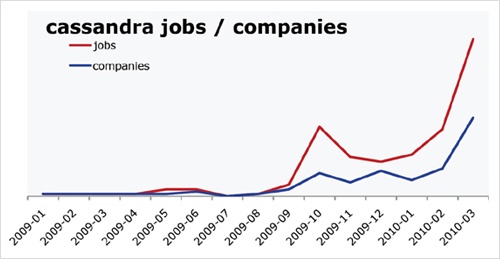
Itâs not easy to get a handle on jobs in data science. However, data from OâReilly Research shows a steady year-over-year increase in Hadoop and Cassandra job listings, which are good proxies for the âdata scienceâ market as a whole. This graph shows the increase in Cassandra jobs, and the companies listing Cassandra positions, over time.
Entrepreneurship is another piece of the puzzle. Patilâs first flippant answer to âwhat kind of person are you looking for when you hire a data scientist?â was âsomeone you would start a company with.â Thatâs an important insight: weâre entering the era of products that are built on data. We donât yet know what those products are, but we do know that the winners will be the people, and the companies, that find those products. Hilary Mason came to the same conclusion. Her job as scientist at bit.ly is really to investigate the data that bit.ly is generating, and find out how to build interesting products from it. No one in the nascent data industry is trying to build the 2012 Nissan Stanza or Office 2015; theyâre all trying to find new products. In addition to being physicists, mathematicians, programmers, and artists, theyâre entrepreneurs.
Data scientists combine entrepreneurship with patience, the willingness to build data products incrementally, the ability to explore, and the ability to iterate over a solution. They are inherently interdiscplinary. They can tackle all aspects of a problem, from initial data collection and data conditioning to drawing conclusions. They can think outside the box to come up with new ways to view the problem, or to work with very broadly defined problems: âhereâs a lot of data, what can you make from it?â
The future belongs to the companies who figure out how to collect and use data successfully. Google, Amazon, Facebook, and LinkedIn have all tapped into their datastreams and made that the core of their success. They were the vanguard, but newer companies like bit.ly are following their path. Whether itâs mining your personal biology, building maps from the shared experience of millions of travellers, or studying the URLs that people pass to others, the next generation of successful businesses will be built around data. The part of Hal Varianâs quote that nobody remembers says it all:
The ability to take dataâto be able to understand it, to process it, to extract value from it, to visualize it, to communicate itâthatâs going to be a hugely important skill in the next decades.
Data is indeed the new Intel Inside.
Storage, MapReduce and Query are ushering in data-driven products and services.
by Edd Dumbill
âBig dataâ is data that becomes large enough that it cannot be processed using conventional methods. Creators of web search engines were among the first to confront this problem. Today, social networks, mobile phones, sensors and science contribute to petabytes of data created daily.
To meet the challenge of processing such large data sets, Google created MapReduce. Googleâs work and Yahooâs creation of the Hadoop MapReduce implementation has spawned an ecosystem of big data processing tools.
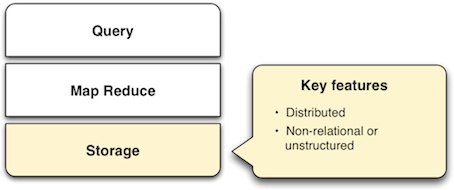
As MapReduce has grown in popularity, a stack for big data systems has emerged, comprising layers of Storage, MapReduce and Query (SMAQ). SMAQ systems are typically open source, distributed, and run on commodity hardware.
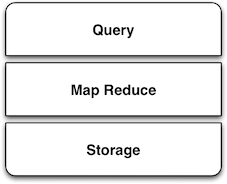
In the same way the commodity LAMP stack of Linux, Apache, MySQL and PHP changed the landscape of web applications, SMAQ systems are bringing commodity big data processing to a broad audience. SMAQ systems underpin a new era of innovative data-driven products and services, in the same way that LAMP was a critical enabler for Web 2.0.
Though dominated by Hadoop-based architectures, SMAQ encompasses a variety of systems, including leading NoSQL databases. This paper describes the SMAQ stack and where todayâs big data tools fit into the picture.
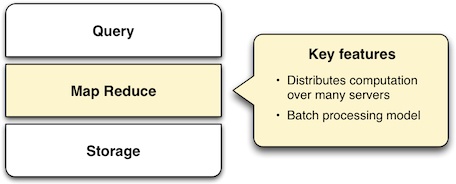
Created at Google in response to the problem of creating web search indexes, the MapReduce framework is the powerhouse behind most of todayâs big data processing. The key innovation of MapReduce is the ability to take a query over a data set, divide it, and run it in parallel over many nodes. This distribution solves the issue of data too large to fit onto a single machine.
To understand how MapReduce works, look at the two phases suggested by its name. In the map phase, input data is processed, item by item, and transformed into an intermediate data set. In the reduce phase, these intermediate results are reduced to a summarized data set, which is the desired end result.
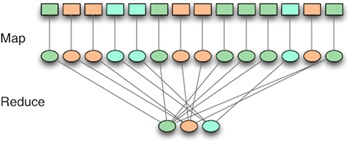
A simple example of MapReduce is the task of counting the number of unique words in a document. In the map phase, each word is identified and given the count of 1. In the reduce phase, the counts are added together for each word.
If that seems like an obscure way of doing a simple task, thatâs because it is. In order for MapReduce to do its job, the map and reduce phases must obey certain constraints that allow the work to be parallelized. Translating queries into one or more MapReduce steps is not an intuitive process. Higher-level abstractions have been developed to ease this, discussed under Query below.
An important way in which MapReduce-based systems differ from conventional databases is that they process data in a batch-oriented fashion. Work must be queued for execution, and may take minutes or hours to process.
Using MapReduce to solve problems entails three distinct operations:
Loading the dataâThis operation is more properly called Extract, Transform, Load (ETL) in data warehousing terminology. Data must be extracted from its source, structured to make it ready for processing, and loaded into the storage layer for MapReduce to operate on it.
MapReduceâThis phase will retrieve data from storage, process it, and return the results to the storage.
Extracting the resultâOnce processing is complete, for the result to be useful to humans, it must be retrieved from the storage and presented.
Many SMAQ systems have features designed to simplify the operation of each of these stages.
Hadoop is the dominant open source MapReduce implementation. Funded by Yahoo, it emerged in 2006 and, according to its creator Doug Cutting, reached âweb scaleâ capability in early 2008.
The Hadoop project is now hosted by Apache. It has grown into a large endeavor, with multiple subprojects that together comprise a full SMAQ stack.
Since it is implemented in Java, Hadoopâs MapReduce implementation is accessible from the Java programming language. Creating MapReduce jobs involves writing functions to encapsulate the map and reduce stages of the computation. The data to be processed must be loaded into the Hadoop Distributed Filesystem.
Taking the word-count example from above, a suitable map function might look like the following (taken from the Hadoop MapReduce documentation, the key operations shown in bold).
public static class Map
        extends Mapper<LongWritable, Text, Text, IntWritable> {

        private final static IntWritable one = new IntWritable(1);
        private Text word = new Text();

        public void map(LongWritable key, Text value, Context context)
             throws IOException, InterruptedException {

                String line = value.toString();
                StringTokenizer tokenizer = new StringTokenizer(line);
                while (tokenizer.hasMoreTokens()) {
                        word.set(tokenizer.nextToken());
                        context.write(word, one);
                }
        }
}
The corresponding reduce function sums the counts for each word.
public static class Reduce
                extends Reducer<Text, IntWritable, Text, IntWritable> {

        public void reduce(Text key, Iterable<IntWritable> values,
                Context context) throws IOException, InterruptedException {

                int sum = 0;
                for (IntWritable val : values) {
                        sum += val.get();
                }
                context.write(key, new IntWritable(sum));
        }
}
The process of running a MapReduce job with Hadoop involves the following steps:
Defining the MapReduce stages in a Java program
Loading the data into the filesystem
Submitting the job for execution
Retrieving the results from the filesystem
Run via the standalone Java API, Hadoop MapReduce jobs can be complex to create, and necessitate programmer involvement. A broad ecosystem has grown up around Hadoop to make the task of loading and processing data more straightforward.
MapReduce has been implemented in a variety of other programming languages and systems, a list of which may be found in Wikipediaâs entry for MapReduce. Notably, several NoSQL database systems have integrated MapReduce, and are described later in this paper.
MapReduce requires storage from which to fetch data and in which to store the results of the computation. The data expected by MapReduce is not relational data, as used by conventional databases. Instead, data is consumed in chunks, which are then divided among nodes and fed to the map phase as key-value pairs. This data does not require a schema, and may be unstructured. However, the data must be available in a distributed fashion, to serve each processing node.
The design and features of the storage layer are important not just because of the interface with MapReduce, but also because they affect the ease with which data can be loaded and the results of computation extracted and searched.
The standard storage mechanism used by Hadoop is the Hadoop Distributed File System, HDFS. A core part of Hadoop, HDFS has the following features, as detailed in the HDFS design document.
Fault toleranceâAssuming that failure will happen allows HDFS to run on commodity hardware.
Streaming data accessâHDFS is written with batch processing in mind, and emphasizes high throughput rather than random access to data.
Extreme scalabilityâHDFS will scale to petabytes; such an installation is in production use at Facebook.
PortabilityâHDFS is portable across operating systems.
Write onceâBy assuming a file will remain unchanged after it is written, HDFS simplifies replication and speeds up data throughput.
Locality of computationâDue to data volume, it is often much faster to move the program near to the data, and HDFS has features to facilitate this.
HDFS provides an interface similar to that of regular filesystems. Unlike a database, HDFS can only store and retrieve data, not index it. Simple random access to data is not possible. However, higher-level layers have been created to provide finer-grained functionality to Hadoop deployments, such as HBase.
One approach to making HDFS more usable is HBase. Modeled after Googleâs BigTable database, HBase is a column-oriented database designed to store massive amounts of data. It belongs to the NoSQL universe of databases, and is similar to Cassandra and Hypertable.
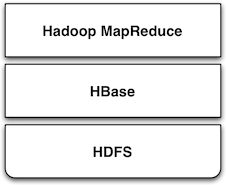
HBase uses HDFS as a storage system, and thus is capable of storing a large volume of data through fault-tolerant, distributed nodes. Like similar column-store databases, HBase provides REST and Thrift based API access.
Because it creates indexes, HBase offers fast, random access to its contents, though with simple queries. For complex operations, HBase acts as both a source and a sink (destination for computed data) for Hadoop MapReduce. HBase thus allows systems to interface with Hadoop as a database, rather than the lower level of HDFS.
Data warehousing, or storing data in such a way as to make reporting and analysis easier, is an important application area for SMAQ systems. Developed originally at Facebook, Hive is a data warehouse framework built on top of Hadoop. Similar to HBase, Hive provides a table-based abstraction over HDFS and makes it easy to load structured data. In contrast to HBase, Hive can only run MapReduce jobs and is suited for batch data analysis. Hive provides a SQL-like query language to execute MapReduce jobs, described in the Query section below.
Cassandra and Hypertable are both scalable column-store databases that follow the pattern of BigTable, similar to HBase.
An Apache project, Cassandra originated at Facebook and is now in production in many large-scale websites, including Twitter, Facebook, Reddit and Digg. Hypertable was created at Zvents and spun out as an open source project.
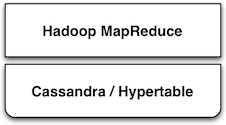
Both databases offer interfaces to the Hadoop API that allow them to act as a source and a sink for MapReduce. At a higher level, Cassandra offers integration with the Pig query language (see the Query section below), and Hypertable has been integrated with Hive.
The storage solutions examined so far have all depended on Hadoop for MapReduce. Other NoSQL databases have built-in MapReduce features that allow computation to be parallelized over their data stores. In contrast with the multi-component SMAQ architectures of Hadoop-based systems, they offer a self-contained system comprising storage, MapReduce and query all in one.
Whereas Hadoop-based systems are most often used for batch-oriented analytical purposes, the usual function of NoSQL stores is to back live applications. The MapReduce functionality in these databases tends to be a secondary feature, augmenting other primary query mechanisms. Riak, for example, has a default timeout of 60 seconds on a MapReduce job, in contrast to the expectation of Hadoop that such a process may run for minutes or hours.
These prominent NoSQL databases contain MapReduce functionality:
CouchDB is a distributed database, offering semi-structured document-based storage. Its key features include strong replication support and the ability to make distributed updates. Queries in CouchDB are implemented using JavaScript to define the map and reduce phases of a MapReduce process.
MongoDB is very similar to CouchDB in nature, but with a stronger emphasis on performance, and less suitability for distributed updates, replication, and versioning. MongoDB MapReduce operations are specified using JavaScript.
Riak is another database similar to CouchDB and MongoDB, but places its emphasis on high availability. MapReduce operations in Riak may be specified with JavaScript or Erlang.
In many applications, the primary source of data is in a relational database using platforms such as MySQL or Oracle. MapReduce is typically used with this data in two ways:
Using relational data as a source (for example, a list of your friends in a social network).
Re-injecting the results of a MapReduce operation into the database (for example, a list of product recommendations based on friendsâ interests).
It is therefore important to understand how MapReduce can interface with relational database systems. At the most basic level, delimited text files serve as an import and export format between relational databases and Hadoop systems, using a combination of SQL export commands and HDFS operations. More sophisticated tools do, however, exist.
The Sqoop tool is designed to import data from relational databases into Hadoop. It was developed by Cloudera, an enterprise-focused distributor of Hadoop platforms. Sqoop is database-agnostic, as it uses the Java JDBC database API. Tables can be imported either wholesale, or using queries to restrict the data import.
Sqoop also offers the ability to re-inject the results of MapReduce from HDFS back into a relational database. As HDFS is a filesystem, Sqoop expects delimited text files and transforms them into the SQL commands required to insert data into the database.
For Hadoop systems that utilize the Cascading API (see the Query section below) the cascading.jdbc and cascading-dbmigrate tools offer similar source and sink functionality.
In addition to relational data sources, streaming data sources, such as web server log files or sensor output, constitute the most common source of input to big data systems. The Cloudera Flume project aims at providing convenient integration between Hadoop and streaming data sources. Flume aggregates data from both network and file sources, spread over a cluster of machines, and continuously pipes these into HDFS. The Scribe server, developed at Facebook, also offers similar functionality.
Several massively parallel processing (MPP) database products have MapReduce functionality built in. MPP databases have a distributed architecture with independent nodes that run in parallel. Their primary application is in data warehousing and analytics, and they are commonly accessed using SQL.
The Greenplum database is based on the open source PostreSQL DBMS, and runs on clusters of distributed hardware. The addition of MapReduce to the regular SQL interface enables fast, large-scale analytics over Greenplum databases, reducing query times by several orders of magnitude. Greenplum MapReduce permits the mixing of external data sources with the database storage. MapReduce operations can be expressed as functions in Perl or Python.
Aster Dataâs nCluster data warehouse system also offers MapReduce functionality. MapReduce operations are invoked using Aster Dataâs SQL-MapReduce technology. SQL-MapReduce enables the intermingling of SQL queries with MapReduce jobs defined using code, which may be written in languages including C#, C++, Java, R or Python.
Other data warehousing solutions have opted to provide connectors with Hadoop, rather than integrating their own MapReduce functionality.
Vertica, famously used by Farmville creator Zynga, is an MPP column-oriented database that offers a connector for Hadoop.
Netezza is an established manufacturer of hardware data warehousing and analytical appliances. Recently acquired by IBM, Netezza is working with Hadoop distributor Cloudera to enhance the interoperation between their appliances and Hadoop. While it solves similar problems, Netezza falls outside of our SMAQ definition, lacking both the open source and commodity hardware aspects.
Although creating a Hadoop-based system can be done entirely with open source, it requires some effort to integrate such a system. Cloudera aims to make Hadoop enterprise-ready, and has created a unified Hadoop distribution in its Cloudera Distribution for Hadoop (CDH). CDH for Hadoop parallels the work of Red Hat or Ubuntu in creating Linux distributions. CDH comes in both a free edition and an Enterprise edition with additional proprietary components and support. CDH is an integrated and polished SMAQ environment, complete with user interfaces for operation and query. Clouderaâs work has resulted in some significant contributions to the Hadoop open source ecosystem.
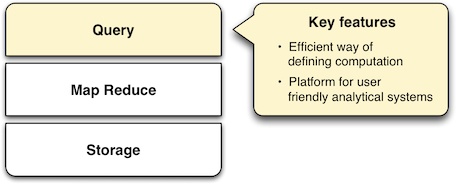
Specifying MapReduce jobs in terms of defining distinct map and reduce functions in a programming language is unintuitive and inconvenient, as is evident from the Java code listings shown above. To mitigate this, SMAQ systems incorporate a higher-level query layer to simplify both the specification of the MapReduce operations and the retrieval of the result.
Many organizations using Hadoop will have already written in-house layers on top of the MapReduce API to make its operation more convenient. Several of these have emerged either as open source projects or commercial products.
Query layers typically offer features that handle not only the specification of the computation, but the loading and saving of data and the orchestration of the processing on the MapReduce cluster. Search technology is often used to implement the final step in presenting the computed result back to the user.
Developed by Yahoo and now part of the Hadoop project, Pig provides a new high-level language, Pig Latin, for describing and running Hadoop MapReduce jobs. It is intended to make Hadoop accessible for developers familiar with data manipulation using SQL, and provides an interactive interface as well as a Java API. Pig integration is available for the Cassandra and HBase databases.
Below is shown the word-count example in Pig, including both the data loading and storing phases (the notation $0 refers to the first field in a record).
input = LOAD 'input/sentences.txt' USING TextLoader();
words = FOREACH input GENERATE FLATTEN(TOKENIZE($0));
grouped = GROUP words BY $0;
counts = FOREACH grouped GENERATE group, COUNT(words);
ordered = ORDER counts BY $0;
STORE ordered INTO 'output/wordCount' USING PigStorage();
While Pig is very expressive, it is possible for developers to write custom steps in User Defined Functions (UDFs), in the same way that many SQL databases support the addition of custom functions. These UDFs are written in Java against the Pig API.
Though much simpler to understand and use than the MapReduce API, Pig suffers from the drawback of being yet another language to learn. It is SQL-like in some ways, but it is sufficiently different from SQL that it is difficult for users familiar with SQL to reuse their knowledge.
As introduced above, Hive is an open source data warehousing solution built on top of Hadoop. Created by Facebook, it offers a query language very similar to SQL, as well as a web interface that offers simple query-building functionality. As such, it is suited for non-developer users, who may have some familiarity with SQL.
Hiveâs particular strength is in offering ad-hoc querying of data, in contrast to the compilation requirement of Pig and Cascading. Hive is a natural starting point for more full-featured business intelligence systems, which offer a user-friendly interface for non-technical users.
The Cloudera Distribution for Hadoop integrates Hive, and provides a higher-level user interface through the HUE project, enabling users to submit queries and monitor the execution of Hadoop jobs.
The Cascading project provides a wrapper around Hadoopâs MapReduce API to make it more convenient to use from Java applications. It is an intentionally thin layer that makes the integration of MapReduce into a larger system more convenient. Cascadingâs features include:
A data processing API that aids the simple definition of MapReduce jobs.
An API that controls the execution of MapReduce jobs on a Hadoop cluster.
Access via JVM-based scripting languages such as Jython, Groovy, or JRuby.
Integration with data sources other than HDFS, including Amazon S3 and web servers.
Validation mechanisms to enable the testing of MapReduce processes.
Cascadingâs key feature is that it lets developers assemble MapReduce operations as a flow, joining together a selection of âpipesâ. It is well suited for integrating Hadoop into a larger system within an organization.
While Cascading itself doesnât provide a higher-level query language, a derivative open source project called Cascalog does just that. Using the Clojure JVM language, Cascalog implements a query language similar to that of Datalog. Though powerful and expressive, Cascalog is likely to remain a niche query language, as it offers neither the ready familiarity of Hiveâs SQL-like approach nor Pigâs procedural expression. The listing below shows the word-count example in Cascalog: it is significantly terser, if less transparent.
(defmapcatop split [sentence]
        (seq (.split sentence "\\s+")))

(?<- (stdout) [?word ?count]
        (sentence ?s) (split ?s :> ?word)
(c/count ?count))An important component of large-scale data deployments is retrieving and summarizing data. The addition of database layers such as HBase provides easier access to data, but does not provide sophisticated search capabilities.
To solve the search problem, the open source search and indexing platform Solr is often used alongside NoSQL database systems. Solr uses Lucene search technology to provide a self-contained search server product.
For example, consider a social network database where MapReduce is used to compute the influencing power of each person, according to some suitable metric. This ranking would then be reinjected to the database. Using Solr indexing allows operations on the social network, such as finding the most influential people whose interest profiles mention mobile phones, for instance.
Originally developed at CNET and now an Apache project, Solr has evolved from being just a text search engine to supporting faceted navigation and results clustering. Additionally, Solr can manage large data volumes over distributed servers. This makes it an ideal solution for result retrieval over big data sets, and a useful component for constructing business intelligence dashboards.
MapReduce, and Hadoop in particular, offers a powerful means of distributing computation among commodity servers. Combined with distributed storage and increasingly user-friendly query mechanisms, the resulting SMAQ architecture brings big data processing within reach for even small- and solo-development teams.
It is now economic to conduct extensive investigation into data, or create data products that rely on complex computations. The resulting explosion in capability has forever altered the landscape of analytics and data warehousing systems, lowering the bar to entry and fostering a new generation of products, services and organizational attitudesâa trend explored more broadly in Mike Loukidesâ âWhat is Data Science?â report.
The emergence of Linux gave power to the innovative developer with merely a small Linux server at their desk: SMAQ has the same potential to streamline data centers, foster innovation at the edges of an organization, and enable new startups to cheaply create data-driven businesses.
Infochimps execs discuss the challenges of data scraping.
In 2008, the Austin-based data startup Infochimps released a scrape of Twitter data that was later taken down at the request of the microblogging site because of user privacy concerns. Infochimps has since struck a deal with Twitter to make some datasets available on the site, and the Infochimps marketplace now contains more than 10,000 datasets from a variety of sources. Not all these datasets have been obtained via scraping, but nevertheless, the companyâs process of scraping, cleaning, and selling big data is an interesting topic to explore, both technically and legally.
With that in mind, Infochimps CEO Nick Ducoff, CTO Flip Kromer, and business development manager Dick Hall explain the business of data scraping in the following interview.
What are the legal implications of data scraping?
Dick Hall: There are three main areas you need to consider: copyright, terms of service, and âtrespass to chattels.â
United States copyright law protects against unauthorized copying of âoriginal works of authorship.â Facts and ideas are not copyrightable. However, expressions or arrangements of facts may be copyrightable. For example, a recipe for dinner is not copyrightable, but a recipe book with a series of recipes selected based on a unifying theme would be copyrightable. This example illustrates the âoriginalityâ requirement for copyright.
Letâs apply this to a concrete web-scraping example. The New York Times publishes a blog post that includes the results of an election poll arranged in descending order by percentage. The New York Times can claim a copyright on the blog post, but not the table of poll results. A web scraper is free to copy the data contained in the table without fear of copyright infringement. However, in order to make a copy of the blog post wholesale, the web scraper would have to rely on a defense to infringement, such as fair use. The result is that it is difficult to maintain a copyright over data, because only a specific arrangement or selection of the data will be protected.
Most websites include a page outlining their terms of service (ToS), which defines the acceptable use of the website. For example, YouTube forbids a user from posting copyrighted materials if the user does not own the copyright. Terms of service are based in contract law, but their enforceability is a gray area in US law. A web scraper violating the letter of a siteâs ToS may argue that they never explicitly saw or agreed to the terms of service.
Assuming ToS are enforceable, they are a risky issue for web scrapers. First, every site on the Internet will have a different ToS â Twitter, Facebook, and The New York Times may all have drastically different ideas of what is acceptable use. Second, a site may unilaterally change the ToS without notice and maintain that continued use represents acceptance of the new ToS by a web scraper or user. For example, Twitter recently changed its ToS to make it significantly more difficult for outside organizations to store or export tweets for any reason.
Thereâs also the issue of volume. High-volume web scraping could cause significant monetary damages to the sites being scraped. For example, if a web scraper checks a site for changes several thousand times per second, it is functionally equivalent to a denial of service attack. In this case, the web scraper may be liable for damages under a theory of âtrespass to chattels,â because the site owner has a property interest in his or her web servers. A good-natured web scraper should be able to avoid this issue by picking a reasonable frequency for scraping.
What are some of the challenges of acquiring data through scraping?
Flip Kromer: There are several problems with the scale and the metadata, as well as historical complications.
Scale â Itâs obvious that terabytes of data will cause problems, but so (on most filesystems) will having tens of millions of files in the same directory tree.
Metadata â Itâs a chicken-and-egg problem. Since few programs can draw on rich metadata, itâs not much use annotating it. But since so few datasets are annotated, itâs not worth writing support into your applications. We have an internal data-description language that we plan to open source as it matures.
Historical complications â Statisticians like SPSS files. Semantic web advocates like RDF/XML. Wall Street quants like Mathematica exports. There is no One True Format. Lifting each out of its source domain is time consuming.
But the biggest non-obvious problem we see is source domain complexity. This is what we call the âuberâ problem. A developer wants the answer to a reasonable question, such as âWhat was the air temperature in Austin at noon on August 6, 1998?â The obvious answer â âdamn hotâ â isnât acceptable. Neither is:
Well, itâs complicated. See, there are multiple weather stations, all reporting temperatures â each with its own error estimate â at different times. So you simply have to take the spatial- and time-average of their reported values across the region. And by the way, did you mean Austinâs city boundary, or its metropolitan area, or its downtown region?
There are more than a dozen incompatible yet fundamentally correct ways to measure time: Earth-centered? Leap seconds? Calendrical? Does the length of a day change as the earthâs rotational speed does?
Data at âeverythingâ scale is sourced by domain experts, who necessarily live at the âitâs complicatedâ level. To make it useful to the rest of the world requires domain knowledge, and often a transformation that is simply nonsensical within the source domain.
How will data marketplaces change the work and direction of data startups?
Nick Ducoff: I vividly remember being taught about comparative advantage. This might age me a bit, but the lesson was: Michael Jordan doesnât mow his own lawn. Why? Because he should spend his time practicing basketball since thatâs what heâs best at and makes a lot of money doing. The same analogy applies to software developers. If you are best at the presentation layer, you donât want to spend your time futzing around with databases
Infochimps allows these developers to spend their time doing what they do best â building apps â while we spend ours doing what we do best â making data easy to find and use. What weâre seeing is startups focusing on pieces of the stack. Over time the big cloud providers will buy these companies to integrate into their stacks.
Companies like Heroku (acquired by Salesforce) and CloudKick (acquired by Rackspace) have paved the way for this. Tools like ScraperWiki and Junar will allow anybody to pull down tables off the web, and companies like Mashery, Apigee and 3scale will continue to make APIs more prevalent. Weâll help make these tables and APIs findable and usable. Developers will be able to go from idea to app in hours, not days or weeks.
This interview was edited and condensed.
A data task illustrates the importance of simple and flexible tools.
The flowering of data science has both driven, and been driven by, an explosion of powerful tools. R provides a great platform for doing statistical analysis, Hadoop provides a framework for orchestrating large clusters to solve problems in parallel, and many NoSQL databases exist for storing huge amounts of unstructured data. The heavy machinery for serious number crunching includes perennials such as Mathematica, Matlab, and Octave, most of which have been extended for use with large clusters and other big iron.
But these tools havenât negated the value of much simpler tools; in fact, theyâre an essential part of a data scientistâs toolkit. Hilary Mason and Chris Wiggins wrote that âSed, awk, grep are enough for most small tasks,â and thereâs a layer of tools below sed, awk, and grep that are equally useful. Hilary has pointed out the value of exploring data sets with simple tools before proceeding to a more in-depth analysis. The advent of cloud computing, Amazonâs EC2 in particular, also places a premium on fluency with simple command-line tools. In conversation, Mike Driscoll of Metamarkets pointed out the value of basic tools like grep to filter your data before processing it or moving it somewhere else. Tools like grep were designed to do one thing and do it well. Because theyâre so simple, theyâre also extremely flexible, and can easily be used to build up powerful processing pipelines using nothing but the command line. So while we have an extraordinary wealth of power tools at our disposal, weâll be the poorer if we forget the basics.
With that in mind, hereâs a very simple, and not contrived, task that I needed to accomplish. Iâm a ham radio operator. I spent time recently in a contest that involved making contacts with lots of stations all over the world, but particularly in Russia. Russian stations all sent their two-letter oblast abbreviation (equivalent to a US state). I needed to figure out how many oblasts I contacted, along with counting oblasts on particular ham bands. Yes, I have software to do that; and no, it wasnât working (bad data file, since fixed). So letâs look at how to do this with the simplest of tools.
(Note: Some of the spacing in the associated data was edited to fit on the page. If you copy and paste the data, a few commands that rely on counting spaces wonât work.)
Log entries look like this:
QSO: 14000 CW 2011-03-19 1229 W1JQ       599 0001  UV5U       599 0041
QSO: 14000 CW 2011-03-19 1232 W1JQ       599 0002  SO2O       599 0043
QSO: 21000 CW 2011-03-19 1235 W1JQ       599 0003  RG3K       599 VR
QSO: 21000 CW 2011-03-19 1235 W1JQ       599 0004  UD3D       599 MO
...
Most of the fields are arcane stuff that we wonât need for these exercises. The Russian entries have a two-letter oblast abbreviation at the end; rows that end with a number are contacts with stations outside of Russia. Weâll also use the second field, which identifies a ham radio band (21000 KHz, 14000 KHz, 7000 KHz, 3500 KHz, etc.) So first, letâs strip everything but the Russians with grep and a regular expression:
$ grep '599 [A-Z][A-Z]' rudx-log.txt | head -2
QSO: 21000 CW 2011-03-19 1235 W1JQ       599 0003  RG3K       599 VR
QSO: 21000 CW 2011-03-19 1235 W1JQ       599 0004  UD3D       599 MO
grep may be the most useful tool in the Unix toolchest. Here, Iâm just searching for lines that have 599 (which occurs everywhere) followed by a space, followed by two uppercase letters. To deal with mixed case (not necessary here), use grep -i. You can use character classes like :upper: rather than specifying the range A-Z, but why bother? Regular expressions can become very complex, but simple will often do the job, and be less error-prone.
If youâre familiar with grep, you may be asking why I didnât use $ to match the end of line, and forget about the 599 noise. Good question. There is some whitespace at the end of the line; weâd have to match that, too. Because this file was created on a Windows machine, instead of just a newline at the end of each line, it has a return and a newline. The $ that grep uses to match the end-of-line only matches a Unix newline. So I did the easiest thing that would work reliably.
The simple head utility is a jewel. If you leave head off of the previous command, youâll get a long listing scrolling down your screen. Thatâs rarely useful, especially when youâre building a chain of commands. head gives you the first few lines of output: 10 lines by default, but you can specify the number of lines you want. -2 says âjust two lines,â which is enough for us to see that this script is doing what we want.
Next, we need to cut out the junk we donât want. The easy way to do this is to use colrm (remove columns). That takes two arguments: the first and last column to remove. Column numbering starts with one, so in this case we can use colrm 1 72.
$ grep '599 [A-Z][A-Z]' rudx-log.txt  | colrm 1 72 | head -2
 VR
 MO
...
How did I know we wanted column 72? Just a little experimentation; command lines are cheap, especially with command history editing. I should actually use 73, but that additional space wonât hurt, nor will the additional whitespace at the end of each line. Yes, there are better ways to select columns; weâll see them shortly. Next, we need to sort and find the unique abbreviations. Iâm going to use two commands here: sort (which does what youâd expect), and uniq (to remove duplicates).
$ grep '599 [A-Z][A-Z]' rudx-log.txt  | colrm 1 72 | sort |\
   uniq | head -2
 AD
 AL
Sort has a -u option that suppresses duplicates, but for some reason I prefer to keep sort and uniq separate. sort can also be made case-insensitive (-f), can select particular fields (meaning we could eliminate the colrm command, too), can do numeric sorts in addition to lexical sorts, and lots of other things. Personally, I prefer building up long Unix pipes one command at a time to hunting for the right options.
Finally, I said I wanted to count the number of oblasts. One of the most useful Unix utilities is a little program called wc: âword count.â Thatâs what it does. Its output is three numbers: the number of lines, the number of words, and the number of characters it has seen. For many small data projects, thatâs really all you need.
$ grep '599 [A-Z][A-Z]' rudx-log.txt  | colrm 1 72 | sort | uniq | wc
      38      38     342
So, 38 unique oblasts. You can say wc -l if you only want to count the lines; sometimes thatâs useful. Notice that we no longer need to end the pipeline with head; we want wc to see all the data.
But I said I also wanted to know the number of oblasts on each ham band. Thatâs the first number (like 21000) in each log entry. So weâre throwing out too much data. We could fix that by adjusting colrm, but I promised a better way to pull out individual columns of data. Weâll use awk in a very simple way:
$ grep '599 [A-Z][A-Z]' rudx-log.txt  | awk '{print $2 " " $11}' |\
     sort | uniq
14000 AD
14000 AL
14000 AN
...
awk is a very powerful tool; itâs a complete programming language that can do almost any kind of text manipulation. We could do everything weâve seen so far as an awk program. But rather than use it as a power tool, Iâm just using it to pull out the second and eleventh fields from my input. The single quotes are needed around the awk program, to prevent the Unix shell from getting confused. Within awkâs print command, we need to explicitly include the space, otherwise it will run the fields together.
The cut utility is another alternative to colrm and awk. Itâs designed for removing portions of a file. cut isnât a full programming language, but it can make more complex transformations than simply deleting a range of columns. However, although itâs a simple tool at heart, it can get tricky; I usually find that, when colrm runs out of steam, itâs best jumping all the way to awk.
Weâre still a little short of our goal: how do we count the number of oblasts on each band? At this point, I use a really cheesy solution: another grep, followed by wc:
$ grep '599 [A-Z][A-Z]' rudx-log.txt  | awk '{print $2 " " $11}' |\
     sort | uniq | grep 21000 | wc
      20      40     180
$ grep '599 [A-Z][A-Z]' rudx-log.txt  | awk '{print $2 " " $11}' |\
     sort | uniq | grep 14000 | wc
      26      52     234
...
OK, 20 oblasts on the 21 MHz band, 26 on the 14 MHz band. And at this point, there are two questions you really should be asking. First, why not put grep 21000 first, and save the awk invocation? Thatâs just how the script developed. You could put the grep first, though youâd still need to strip extra gunk from the file. Second: What if there are gigabytes of data? You have to run this command for each band, and for some other project, you might need to run it dozens or hundreds of times. Thatâs a valid objection. To solve this problem, you need a more complex awk script (which has associative arrays in which you can save data), or you need a programming language such as perl, python, or ruby. At the same time, weâve gotten fairly far with our data exploration, using only the simplest of tools.
Now letâs up the ante. Letâs say that there are a number of directories with lots of files in them, including these rudx-log.txt files. Letâs say that these directories are organized by year (2001, 2002, etc.). And letâs say we want to count oblasts across all the years for which we have records. How do we do that?
Hereâs where we need find. My first approach is to take the filename (rudx-log.txt) out of the grep command, and replace it with a find command that looks for every file named rudx-log.txt in subdirectories of the current directory:
$ grep '599 [A-Z][A-Z]' `find . -name rudx-log.txt -print`  |\
   awk '{print $2 " " $11}' | sort | uniq | grep 14000 | wc
      48      96     432
OK, so 48 directories on the 14 MHz band, lifetime. I thought I had done better than that. Whatâs happening, though? That find command is simply saying âlook at the current directory and its subdirectories, find files with the given name, and print the output.â The backquotes tell the Unix shell to use the output of find as arguments to grep. So weâre just giving grep a long list of files, instead of just one. Note the -print option: if itâs not there, find happily does nothing.
Weâre almost done, but there are a couple of bits of hair you should worry about. First, if you invoke grep with more than one file on the command line, each line of output begins with the name of the file in which it found a match:
...
./2008/rudx-log.txt:QSO: 14000 CW 2008-03-15 1526 W1JQ      599 0054 \\
UA6YW         599 AD
./2009/rudx-log.txt:QSO: 14000 CW 2009-03-21 1225 W1JQ      599 0015 \\
RG3K          599 VR
...
Weâre lucky. grep just sticks the filename at the beginning of the line without adding spaces, and weâre using awk to print selected whitespace-separated fields. So the number of any field didnât change. If we were using colrm, weâd have to fiddle with things to find the right columns. If the filenames had different lengths (reasonably likely, though not possible here), we couldnât use colrm at all. Fortunately, you can suppress the filename by using grep -h.
The second piece of hair is less common, but potentially more troublesome. If you look at the last command, what weâre doing is giving the find command a really long list of filenames. How long is long? Can that list get too long? The answers are âwe donât know,â and âmaybe.â In the nasty old days, things broke when the command line got longer than a few thousand characters. These days, who knows whatâs too long ... But weâre doing âbig data,â so itâs easy to imagine the find command expanding to hundreds of thousands, even millions of characters. More than that, our single Unix pipeline doesnât parallelize very well; and if we really have big data, we want to parallelize it.
The answer to this problem is another old Unix utility, xargs. Xargs dates back to the time when it was fairly easy to come up with file lists that were too long. Its job is to break up command line arguments into groups and spawn as many separate commands as needed, running in parallel if possible (-P). Weâd use it like this:
$ find . -name rudx-log.txt -print | xargs grep '599 [A-Z][A-Z]'  |\
  awk '{print $2 " " $11}' | grep 14000 | sort | uniq | wc
      48      96     432
This command is actually a nice little map-reduce implementation: the xargs command maps grep all the cores on your machine, and the output is reduced (combined) by the awk/sort/uniq chain. xargs has lots of command line options, so if you want to be confused, read the man page.
Another approach is to use findâs -exec option to invoke arbitrary commands. Itâs somewhat more flexible than xargs, though in my opinion, find -exec has the sort of overly flexible but confusing syntax thatâs surprisingly likely to lead to disaster. (Itâs worth noting that the examples for -exec almost always involve automating bulk file deletion. Excuse me, but thatâs a recipe for heartache. Take this from the guy who once deleted the business plan, then found that the backups hadnât been done for about 6 months.) Thereâs an excellent tutorial for both xargs and find -exec at Softpanorama. I particularly like this tutorial because it emphasizes testing to make sure that your command wonât run amok and do bad things (like deleting the business plan).
Thatâs not all. Back in the dark ages, I wrote a shell script that did a recursive grep through all the subdirectories of the current directory. Thatâs a good shell programming exercise which Iâll leave to the reader. More to the point, Iâve noticed that thereâs now a -R option to grep that makes it recursive. Clever little buggers ...
Before closing, Iâd like to touch on a couple of tools that are a bit more exotic, but which should be in your arsenal in case things go wrong. od -c gives a raw dump of every character in your file. (-c says to dump characters, rather than octal or hexadecimal). Itâs useful if you think your data is corrupted (it happens), or if it has something in it that you didnât expect (it happens a LOT). od will show you whatâs happening; once you know what the problem is, you can fix it. To fix it, you may want to use sed. sed is a cranky old thing: more than a hand tool, but not quite a power tool; sort of an antique treadle-operated drill press. Itâs great for editing files on the fly, and doing batch edits. For example, you might use it if NUL characters were scattered through the data.
Finally, a tool I just learned about (thanks, @dataspora): the pipe viewer, pv. It isnât a standard Unix utility. It comes with some versions of Linux, but the chances are that youâll have to install it yourself. If youâre a Mac user, itâs in macports. pv tells you whatâs happening inside the pipes as the command progresses. Just insert it into a pipe like this:
$ find . -name rudx-log.txt -print | xargs grep '599 [A-Z][A-Z]'  |\
  awk '{print $2 " " $11}' | pv | grep 14000 | sort | uniq | wc
3.41kB 0:00:00 [  20kB/s] [<=>
      48      96     432
The pipeline runs normally, but youâll get some additional output that shows the commandâs progress. If somethingâs getting malfunctioning or performing too slowly, youâll find out. pv is particularly good when you have huge amounts of data, and you canât tell whether something has ground to a halt, or you just need to go out for coffee while the command runs to completion.
Whenever you need to work with data, donât overlook the Unix âhand tools.â Sure, everything Iâve done here could be done with Excel or some other fancy tool like R or Mathematica. Those tools are all great, but if your data is living in the cloud, using these tools is possible, but painful. Yes, we have remote desktops, but remote desktops across the Internet, even with modern high-speed networking, are far from comfortable. Your problem may be too large to use the hand tools for final analysis, but theyâre great for initial explorations. Once you get used to working on the Unix command line, youâll find that itâs often faster than the alternatives. And the more you use these tools, the more fluent youâll become.
Oh yeah, that broken data file that would have made this exercise superfluous? Someone emailed it to me after I wrote these scripts. The scripting took less than 10 minutes, start to finish. And, frankly, it was more fun.
Cloudera CEO Mike Olson on Hadoopâs architecture and its data applications.
by James Turner
Hadoop gets a lot of buzz these days in database and content management circles, but many people in the industry still donât really know what it is and or how it can be best applied.
Cloudera CEO and Strata speaker Mike Olson, whose company offers an enterprise distribution of Hadoop and contributes to the project, discusses Hadoopâs background and its applications in the following interview.
Where did Hadoop come from?
Mike Olson: The underlying technology was invented by Google back in their earlier days so they could usefully index all the rich textural and structural information they were collecting, and then present meaningful and actionable results to users. There was nothing on the market that would let them do that, so they built their own platform. Googleâs innovations were incorporated into Nutch, an open source project, and Hadoop was later spun-off from that. Yahoo has played a key role developing Hadoop for enterprise applications.
What problems can Hadoop solve?
Mike Olson: The Hadoop platform was designed to solve problems where you have a lot of data â perhaps a mixture of complex and structured data â and it doesnât fit nicely into tables. Itâs for situations where you want to run analytics that are deep and computationally extensive, like clustering and targeting. Thatâs exactly what Google was doing when it was indexing the web and examining user behavior to improve performance algorithms.
Hadoop applies to a bunch of markets. In finance, if you want to do accurate portfolio evaluation and risk analysis, you can build sophisticated models that are hard to jam into a database engine. But Hadoop can handle it. In online retail, if you want to deliver better search answers to your customers so theyâre more likely to buy the thing you show them, that sort of problem is well addressed by the platform Google built. Those are just a few examples.
How is Hadoop architected?
Mike Olson: Hadoop is designed to run on a large number of machines that donât share any memory or disks. That means you can buy a whole bunch of commodity servers, slap them in a rack, and run the Hadoop software on each one. When you want to load all of your organizationâs data into Hadoop, what the software does is bust that data into pieces that it then spreads across your different servers. Thereâs no one place where you go to talk to all of your data; Hadoop keeps track of where the data resides. And because there are multiple copy stores, data stored on a server that goes offline or dies can be automatically replicated from a known good copy.
In a centralized database system, youâve got one big disk connected to four or eight or 16 big processors. But that is as much horsepower as you can bring to bear. In a Hadoop cluster, every one of those servers has two or four or eight CPUs. You can run your indexing job by sending your code to each of the dozens of servers in your cluster, and each server operates on its own little piece of the data. Results are then delivered back to you in a unified whole. Thatâs MapReduce: you map the operation out to all of those servers and then you reduce the results back into a single result set.
Architecturally, the reason youâre able to deal with lots of data is because Hadoop spreads it out. And the reason youâre able to ask complicated computational questions is because youâve got all of these processors, working in parallel, harnessed together.
At this point, do companies need to develop their own Hadoop applications?
Mike Olson: Itâs fair to say that a current Hadoop adopter must be more sophisticated than a relational database adopter. There are not that many âshrink wrappedâ applications today that you can get right out of the box and run on your Hadoop processor. Itâs similar to the early â80s when Ingres and IBM were selling their database engines and people often had to write applications locally to operate on the data.
That said, you can develop applications in a lot of different languages that run on the Hadoop framework. The developer tools and interfaces are pretty simple. Some of our partners â Informatica is a good example â have ported their tools so that theyâre able to talk to data stored in a Hadoop cluster using Hadoop APIs. There are specialist vendors that are up and coming, and there are also a couple of general process query tools: a version of SQL that lets you interact with data stored on a Hadoop cluster, and Pig, a language developed by Yahoo that allows for data flow and data transformation operations on a Hadoop cluster.
Hadoopâs deployment is a bit tricky at this stage, but the vendors are moving quickly to create applications that solve these problems. I expect to see more of the shrink-wrapped apps appearing over the next couple of years.
Where do you stand in the SQL vs NoSQL debate?
Mike Olson: Iâm a deep believer in relational databases and in SQL. I think the language is awesome and the products are incredible.
I hate the term âNoSQL.â It was invented to create cachet around a bunch of different projects, each of which has different properties and behaves in different ways. The real question is, what problems are you solving? Thatâs what matters to users.
A look at free services that reveal traffic data, server details and popularity.
by Pete Warden
Note: The following is an excerpt from Pete Wardenâs free ebook âWhere are the bodies buried on the web? Big data for journalists.â
Thereâs been a revolution in data over the last few years, driven by an astonishing drop in the price of gathering and analyzing massive amounts of information. It only cost me $120 to gather, analyze and visualize 220 million public Facebook profiles, and you can use 80legs to download a million web pages for just $2.20. Those are just two examples.
The technology is also getting easier to use. Companies like Extractiv and Needlebase are creating point-and-click tools for gathering data from almost any site on the web, and every other stage of the analysis process is getting radically simpler too.
What does this mean for journalists? You no longer have to be a technical specialist to find exciting, convincing and surprising data for your stories. For example, the following four services all easily reveal underlying data about web pages and domains.
Many of you will already be familiar with WHOIS, but itâs so useful for research itâs still worth pointing out. If you go to this site (or just type âwhois www.example.comâ in Terminal.app on a Mac) you can get the basic registration information for any website. In recent years, some owners have chosen âprivateâ registration, which hides their details from view, but in many cases youâll see a name, address, email and phone number for the person who registered the site.
You can also enter numerical IP addresses here and get data on the organization or individual that owns that server. This is especially handy when youâre trying to track down more information on an abusive or malicious user of a service, since most websites record an IP address for everyone who accesses them
The newest search engine in town, one of Blekkoâs selling points is the richness of the data it offers. If you type in a domain name followed by /seo, youâll receive a page of statistics on that URL:

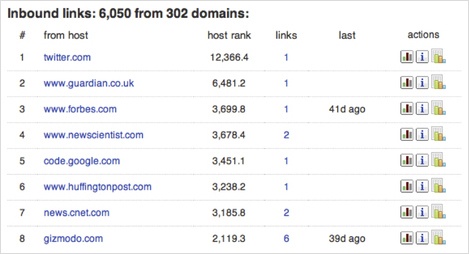
The first tab shows other sites that are linking to the current domain, in popularity order. This can be extremely useful when youâre trying to understand what coverage a site is receiving, and if you want to understand why itâs ranking highly in Googleâs search results, since theyâre based on those inbound links. Inclusion of this information would have been an interesting addition to the recent DecorMyEyes story, for example.
The other handy tab is âCrawl stats,â especially the âCohosted withâ section:
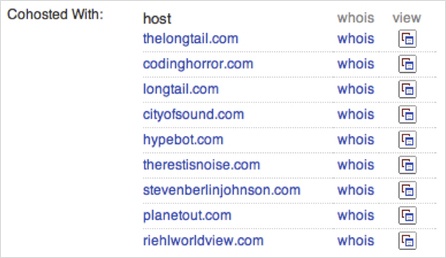
This tells you which other websites are running from the same machine. Itâs common for scammers and spammers to astroturf their way toward legitimacy by building multiple sites that review and link to each other. They look like independent domains, and may even have different registration details, but often theyâll actually live on the same server because thatâs a lot cheaper. These statistics give you an insight into the hidden business structure of shady operators.
I always turn to bit.ly when I want to know how people are sharing a particular link. To use it, enter the URL youâre interested in:

Then click on the âInfo Page+â link:
That takes you to the full statistics page (though you may need to choose âaggregate bit.ly linkâ first if youâre signed in to the service).

This will give you an idea of how popular the page is, including activity on Facebook and Twitter. Below that youâll see public conversations about the link provided by backtype.com.

I find this combination of traffic data and conversations very helpful when Iâm trying to understand why a site or page is popular, and who exactly its fans are. For example, it provided me with strong evidence that the prevailing narrative about grassroots sharing and Sarah Palin was wrong.
[Disclosure: OâReilly AlphaTech Ventures is an investor in bit.ly.]
By surveying a cross-section of American consumers, Compete builds up detailed usage statistics for most websites, and they make some basic details freely available.
Choose the âSite Profileâ tab and enter a domain:

Youâll then see a graph of the siteâs traffic over the last year, together with figures for how many people visited, and how often.
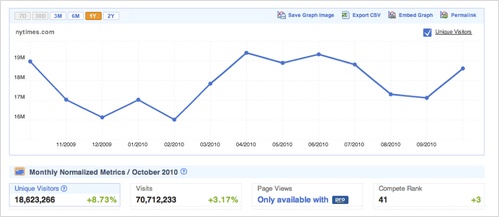
Since theyâre based on surveys, Competeâs numbers are only approximate. Nonetheless, Iâve found them reasonably accurate when Iâve been able to compare them against internal analytics.
Competeâs stats are a good source when comparing two sites. While the absolute numbers may be off for both sites, Compete still offers a decent representation of the sitesâ relative difference in popularity.
One caveat: Compete only surveys U.S. consumers, so the data will be poor for predominantly international sites.
Additional data resources and tools are discussed in Peteâs free ebook.
Alasdair Allan on how machine learning is taking over the mainstream.
by Jenn Webb
The concept of machine learning was brought to the forefront for the general masses when IBMâs Watson computer appeared on Jeopardy and wiped the floor with humanity. For those same masses, machine learning quickly faded from view as Watson moved out of the spotlight ... or so they may think.
Machine learning is slowly and quietly becoming democratized. Goodreads, for instance, recently purchased Discovereads.com, presumably to make use of its machine learning algorithms to make book recommendations.
To find out more about whatâs happening in this rapidly advancing field, I turned to Alasdair Allan, an author and senior research fellow in Astronomy at the University of Exeter. In an email interview, he talked about how machine learning is being used behind the scenes in everyday applications. He also discussed his current eSTAR intelligent robotic telescope network project and how that machine learning-based system could be used in other applications.
In what ways is machine learning being used?
Alasdair Allan: Machine learning is quietly taking over in the mainstream. Orbitz, for instance, is using it behind the scenes to optimize caching of hotel prices, and Google is going to roll out smarter advertisements â much of the machine learning that consumers are seeing and using every day is invisible to them.
The interesting thing about machine learning right now is that research in the field is going on quietly as well because large corporations are tied up in non-disclosure agreements. While there is a large amount of academic literature on the subject, itâs actually hard to tell whether this open research is actually current.
Oddly, machine learning research mirrors the way cryptography research developed around the middle of the 20th century. Much of the cutting edge research was done in secret, and weâre only finding out now, 40 or 50 years later, what GCHQ or the NSA was doing back then. Iâm hopeful that it wonât take quite that long for Amazon or Google to tell us what theyâre thinking about today.
How does your eSTAR intelligent robotic telescope network work?
Alasdair Allan: My work has focused on applying intelligent agent architectures and techniques to astronomy for telescope control and scheduling, and also for data mining. Iâm currently leading the work at Exeter building a peer-to-peer distributed network of telescopes that, acting entirely autonomously, can reactively schedule observations of time-critical transient events in real-time. Notable successes include contributing to the detection of the most distant object yet discovered, a gamma-ray burster at a redshift of 8.2.
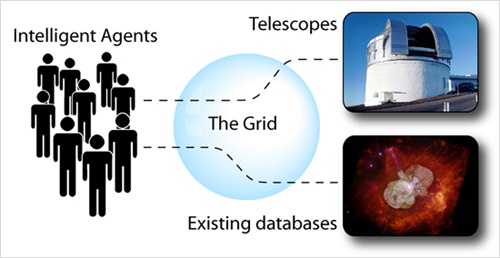
All the components of the system are thought of as agents â effectively âsmartâ pieces of software. Negotiation takes place between the agents in the system. each of the resources bids to carry out the work, with the science agent scheduling the work with the agent embedded at the resource that promises to return the best result.
This architectural distinction of viewing both sides of the negotiation as agents â and as equals â is crucial. Importantly, this preserves the autonomy of individual resources to implement observation scheduling at their facilities as they see fit, and it offers increased adaptability in the face of asynchronously arriving data.
The system is a meta-network that layers communication, negotiation, and real-time analysis software on top of existing telescopes, allowing scheduling and prioritization of observations to be done locally. It is flat, peer-to-peer, and owned and operated by disparate groups with their own goals and priorities. There is no central master-scheduler overseeing the network â optimization arises through emerging complexity and social convention.
How could the ideas behind eSTAR be applied elsewhere?
Alasdair Allan: Essentially what Iâve built is a geographically distributed sensor architecture. The actual architectures Iâve used to do this are entirely generic â fundamentally, itâs just a peer-to-peer distributed system for optimizing scarce resources in real-time in the face of a constantly changing environment.
The architectures are therefore equally applicable to other systems. The most obvious use case is sensor motes. Cheap, possibly even disposable, single-use, mesh-networked sensor bundles could be distributed over a large geographic area to get situational awareness quickly and easily. Despite the underlying hardware differences, the same distributed machine learning-based architectures can be used.
At Februaryâs Strata conference, Alasdair Allan discussed the ambiguity surrounding a formal definition of machine learning:
This interview was edited and condensed.
Linked data allows for deep and serendipitous consumer experiences.
by Tyler Bell
In the same way that the Holy Roman Empire was neither holy nor Roman, Facebookâs OpenGraph Protocol is neither open nor a protocol. It is, however, an extremely straightforward and applicable standard for document metadata. From a strictly semantic viewpoint, OpenGraph is considered hardly worthy of comment: it is a frankenstandard, a mishmash of microformats and loosely-typed entities, lobbed casually into the semantic web world with hardly a backward glance.
But this is not important. While OpenGraph avoids, or outright ignores, many of the problematic issues surrounding semantic annotation (see Alex Iskoldâs excellent commentary on OpenGraph here on Radar), criticism focusing only on its technical purity is missing half of the equation. Facebook gets it right where other initiatives have failed. While OpenGraph is incomplete and imperfect, it is immediately usable and sympathetic with extant approaches. Most importantly, OpenGraph is one component in a wider ecosystem. Its deployment benefits are apparent to the consumer and the developer: add the metatags, get the âlikes,â know your customers.
Such consumer causality is critical to the adoption of any semantic mark-up. Weâve seen it before with microformats, whose eventual popularity was driven by their ability to improve how a page is represented in search engine listings, and not by an abstract desire to structure the unstructured. Successful adoption will often entail sacrificing standardization and semantic purity for pragmatic ease-of-use; this is where the semantic web appears to have stumbled, and where linked data will most likely succeed.
Linked data intends to make the Web more interconnected and data-oriented. Beyond this outcome, the term is less rigidly defined. I would argue that linked data is more of an ethos than a standard, focused on providing context, assisting in disambiguation, and increasing serendipity within the user experience. This idea of linked data can be delivered by a number of existing components that work together on the data, platform, and application levels:
Entity provision: Defining the who, what, where and when of the Internet, entities encapsulate meaning and provide context by type. In its most basic sense, an entity is one row in a list of things organized by typeâsuch as people, places, or productsâeach with a unique identifier. Organizations that realize the benefits of linked data are releasing entities like never before, including the publication of 10,000 subject headings by the New York Times, admin regions and postcodes from the UKâs Ordnance Survey, placenames from Yahoo GeoPlanet, and the data infrastructures being created by Factual [disclosure: Iâve just signed on with Factual].
Entity annotation: There are numerous formats for annotating entities when they exist in unstructured content, such as a web page or blog post. Facebookâs OpenGraph is a form of entity annotation, as are HTML5 microdata, RDFa, and microformats such as hcard. Microdata is the shiny, new player in the game, but see Evan Prodromouâs great post on RDFa v. microformats for a breakdown of these two more established approaches.
Endpoints and Introspection: Entities contribute best to a linked data ecosystem when each is associated with a Uniform Resource Identifier (URI), an Internet-accessible, machine readable endpoint. These endpoints should provide introspection, the means to obtain the properties of that entity, including its relationship to others. For example, the Ordnance Survey URI for the âCity of Southamptonâ is http://data.ordnancesurvey.co.uk/id/7000000000037256. Its properties can be retrieved in machine-readable format (RDF/XML,Turtle and JSON) by appending an ârdf,â âttl,â or âjsonâ extension to the above. To be properly open, URIs must be accessible outside a formal API and authentication mechanism, exposed to semantically-aware web crawlers and search tools such as Yahoo BOSS. Under this definition, local business URLs, for example, can serve in-part as URIsââview sourceâ to see the semi-structured data in these listings from Yelp (using hcard and OpenGraph), and Foursquare (using microdata and OpenGraph).
Entity extraction: Some linked data enthusiasts long for the day when all content is annotated so that it can be understood equally well by machines and humans. Until we get to that happy place, we will continue to rely on entity extraction technologies that parse unstructured content for recognizable entities, and make contextually intelligent identifications of their type and identifier. Named entity recognition (NER) is one approach that employs the above entity lists, which may also be combined with heuristic approaches designed to recognize entities that lie outside of a known entity list. Yahoo, Google and Microsoft are all hugely interested in this area, and weâll see an increasing number of startups like Semantinet emerge with ever-improving precision and recall. If you want to see how entity extraction works first-hand, check out Reuters-owned Open Calais and experiment with their form-based tool.
Entity concordance and crosswalking: The multitude of place namespaces illustrates how a single entity, such as a local business, will reside in multiple lists. Because the âuniqueâ (U) in a URI is unique only to a given namespace, a world driven by linked data requires systems that explicitly match a single entity across namespaces. Examples of crosswalking services include: Placecastâs Match API, which returns the Placecast IDs of any place when supplied with an hcard equivalent; Yahooâs Concordance, which returns the Where on Earth Identifier (WOEID) of a place using as input the place ID of one of fourteen external resources, including OpenStreetMap and Geonames; and the Guardian Content API, which allows users to search Guardian content using non-Guardian identifiers. These systems are the unsung heroes of the linked data world, facilitating interoperability by establishing links between identical entities across namespaces. Huge, unrealized value exists within these applications, and we need more of them.
Relationships: Entities are only part of the story. The real power of the semantic web is realized in knowing how entities of different types relate to each other: actors to movies, employees to companies, politicians to donors, restaurants to neighborhoods, or brands to stores. The power of all graphsâthese networks of entitiesâis not in the entities themselves (the nodes), but how they relate together (the edges). However, I may be alone in believing that we need to nail the problem of multiple instances of the same entity, via concordance and crosswalking, before we can tap properly into the rich vein that entity relationships offer.
The approaches outlined above combine to help publishers and application developers provide intelligent, deep and serendipitous consumer experiences. Examples include the semantic handset from Aro Mobile, the BBCâs World Cup experience, and aggregating references on your Facebook news feed.
Linked data will triumph in this space because efforts to date focus less on the how and more on the why. RDF, SPARQL, OWL, and triple stores are onerous. URIs, micro-formats, RDFa, and JSON, less so. Why invest in difficult technologies if consumer outcomes can be realized with extant tools and knowledge? We have the means to realize linked data nowâthe pieces of the puzzle are there and we (just) need to put them together.
Linked data is, at last, bringing the discussion around to the user. The consumer âendâ trumps the semantic âmeans.â
âMining the Social Webâ author Matthew Russell on the questions and answers social data can handle.
by Mac Slocum
Weâre still in the stage where access to massive amounts of social data has novelty. Thatâs why companies are pumping out APIs and services are popping up to capture and sort all that information. But over time, as the novelty fades and the toolsets improve, weâll move into a new phase thatâs defined by the application of social data. Access will be implied. Itâs what you do with the data that will matter.
Matthew Russell (@ptwobrussell), author of âMining the Social Webâ and a speaker at the upcoming Where 2.0 Conference, has already rounded that corner. In the following interview, Russell discusses the tools and the mindset that can unlock social dataâs real utility.
How do you define the âsocial webâ?
Matthew Russell: The âsocial webâ is admittedly a notional entity with some blurry boundaries. There isnât a Venn diagram that carves the âsocial webâ out of the overall web fabric. The web is inherently a social fabric, and itâs getting more social all the time.
The distinction I make is that some parts of the fabric are much easier to access than others. Naturally, the platforms that expose their data with well-defined APIs will be the ones to receive the most attention and capture the mindshare when someone thinks of the âsocial web.â
In that regard, the social web is more of a heatmap where the hot areas are popular social networking hubs like Twitter, Facebook, and LinkedIn. Blogs, mailing lists, and even source code repositories such as Source Forge GitHub, however, are certainly part of the social web.
What sorts of questions can social data answer?
Matthew Russell: Here are some concrete examples of questions I asked â and answered â in âMining the Social Webâ:
Whatâs your potential influence when you tweet?
What does Justin Bieber have (or not have) in common with the Tea Party?
Where does most of your professional network geographically reside, and how might this impact career decisions?
How do you summarize the content of blog posts to quickly get the gist?
Which of your friends on Twitter, Facebook, or elsewhere know one another, and how well?
Itâs not hard at all to ask lots of valuable questions against social web data and answer them with high degrees of certainty. The most popular sources of social data are popular because theyâre generally platforms that expose the data through well-crafted APIs. The effect is that itâs fairly easy to amass the data that you need to answer questions.
With the necessary data in hand to answer your questions, the selection of a programming language, toolkit, and/or framework that makes shaking out the answer is a critical step that shouldnât be taken lightly. The more efficient it is to test your hypotheses, the more time you can spend analyzing your data. Spending sufficient time in analysis engenders the kind of creative freedom needed to produce truly interesting results. This why organizations like Infochimps and GNIP are filling a critical void.
What programming skills or development background do you need to effectively analyze social data?
Matthew Russell: A basic programming background definitely helps, because it allows you to automate so many of the mundane tasks that are involved in getting the data and munging it into a normalized form thatâs easy to work with. That said, the lack of a programming background should be among the last things that stops you from diving head first into social data analysis. If youâre sufficiently motivated and analytical enough to ask interesting questions, thereâs a very good chance you can pick up an easy language, like Python or Ruby, and learn enough to be dangerous over a weekend. The rest will take care of itself.
Why did you opt to use GitHub to share the example code from the book?
Matthew Russell: GitHub is a fantastic source code management tool, but the most interesting thing about it is that itâs a social coding repository. What GitHub allows you to do is share code in such a way that people can clone your code repository. They can make improvements or fork the examples into an entirely new form, and then share those changes with the rest of the world in a very transparent way.
If you look at the project I started on GitHub, you can see exactly who did what with the code, whether I incorporated their changes back into my own repository, whether someone else has done something novel by using an example listing as a template, etc. You end up with a community of people that emerge around common causes, and amazing things start to happen as these people share and communicate about important problems and ways to solve them.
While I of course want people buy the book, all of the source code is out there for the taking. I hope people put it to good use.
Jud Valeski on how Gnip handles the Twitter fire hose.
Although Gnip handles real-time streaming of data from a variety of social media sites, itâs best known as the official commercial provider of the Twitter activity stream.
Frankly, âstreamâ is a misnomer. âFire hose,â the colloquial variation, better represents the torrent of data Twitter produces. That hose pumps out around 155 million tweets per day, and itâs all addressed at a sustained rate.
I recently spoke with Gnip CEO Jud Valeski (@jvaleski) about what it takes to manage Twitterâs flood of data and how the Internetâs architecture needs to adapt to real-time needs. Our interview follows.
The Internet wasnât really built to handle a river of big data. What are the architectural challenges of running real-time data through these pipes?
Jud Valeski: The most significant challenge is rusty infrastructure. Just as with many massive infrastructure projects that the world has seen, adopted, and exploited (aqueducts, highways, power/energy grids), the connective tissue of the network becomes excruciatingly dated. Weâre lucky to have gotten as far as we have on it. The capital build-outs on behalf of the telecommunications industry have yielded relatively low-bandwidth solutions laden with false advertising about true throughput. The upside is that highly transactional HTTP REST apps are relatively scalable in this environment and they âjust work.â It isnât until we get into heavy payload apps â video streaming, large-scale activity fire hoses like Twitter â that the deficiencies in todayâs network get put in the spotlight. Thatâs when the pipes begin to burst.
We can redesign applications to create smaller activities/actions in order to reduce overall sizes. We can use tighter protocols/formats (Protocol Buffers for example), and compression to minimize sizes as well. However, with the ever-increasing usage of social networks generating more âactivities,â weâre running into true pipe capacity limits, and those limits often come with very hard stops. Typical business-class network connections donât come close to handling high volumes, and you can forget about consumer-class connections handling them.
Beyond infrastructure issues, as engineers, the web app programming weâve been doing over the past 15 years has taught us to build applications in a highly synchronous transactional manner. Because each HTTP transaction generally only lasts a second or so at most, itâs easy to digest and process many discrete chunks of data. However, the bastard stepchild of every HTTP libâs âget()â routine that returns the complete result, is the âread()â routine that only gives you a poorly bounded chunk.
You would be shocked at the ratio of engineers who canât build event-driven, asynchronous data processing applications, to those who can, yet this is a big part of this space. Lack of ecosystem knowledge around these kinds of programming primitives is a big problem. Many higher level abstractions exist for streaming HTTP apps, but theyâre not industrial strength, and therefore you have to really know whatâs going on to build your own.
Shifting back to infrastructure: Often the bigger issue plaguing the network itself is one of latency, not throughput. While data tends to move quickly once streaming connections are established, inevitable reconnects create gaps. The longer those connections take to stand up, the bigger the gaps. Run a traceroute to your favorite API and see how many hops you take. Itâs not pretty. Latencies on the network are generally a function of router and gateway clutter, as our packets bounce across a dozen servers just to get to the main server and then back to the client.
How is Gnip addressing these issues?
Jud Valeski: On the infrastructure side, we are trying (successfully to-date) to use existing, relatively off the shelf, back plane network topologies in the cloud to build our systems. We live on EC2 Larges and XLs to ensure dedicated NICs in our clusters. That helps with the router and gateway clutter. Weâre also working with Amazon to ensure seamless connection upgrades as volumes increase. These are use cases they actually want to solve at a platform level, so our incentives are nicely aligned. We also play at the IP-stack level to ensure packet transmission is optimized for constant high-volume streams.
Once total volumes move past standard inbound and outbound connection capabilities, we will be offering dedicated interconnects. However, those come at a very steep price for us and our volume customers.
All of this leads me to my real answer: Trimming the fat.
While a sweet spot for us is certainly high-volume data consumers, there are many folks who donât want volume, they want coverage. Coverage of just the activities they care about; usually their customersâ brands or products. We take on the challenge of digesting and processing the high volume on inbound, and distill the stream down to just the bits our coverage customers desire. You may need 100% of the activities that mention âgood food,â but that obviously isnât 100% of a publisherâs fire hose. Processing high-velocity root streams on behalf of hundreds of customers without adversely impacting latency takes a lot of work. Today, that means good olâ-fashioned engineering.
What tools and infrastructure changes are needed to better handle big-data streaming?
Jud Valeski: âBig dataâ as we talk about it today has been slayed by lots of cool abstractions (e.g. Hadoop) that fit nicely into the way we think about the stack we all know and love. âBig streams,â on the other hand, challenge the parallelization primitives folks have been solving for âbig data.â Thereâs very little overlap, unfortunately. So, on the software solution side, better and more widely used frameworks are needed. Companies like BackType and Gnip pushing their current solutions onto the network for open refinement would be an awesome step forward. Iâm intrigued by the prospect of BackTypeâs Storm project, and Iâm looking forward to seeing more of it. More brains lead to better solutions.
We shouldnât be giving CPU and network latency injection a second thought, but we have to. The code I write to process bits as they come off the wire â quickly â should just âgo fast,â regardless of its complexity. Thatâs too hard today. It requires too much custom code.
On the infrastructure side of things, ISPs need to provide cheaper access to reliable fat pipes. If they donât, software will outpace their lack of innovation. To be clear, they donât get this and the software will lap them. You asked what I think we need, not what I think weâll actually get.
This interview was edited and condensed.
[1] The NASA article denies this, but also says that in 1984, they decided that the low values (whch went back to the 70s) were âreal.â Whether humans or software decided to ignore anomalous data, it appears that data was ignored.
[2] âInformation Platforms as Dataspaces,â by Jeff Hammerbacher (in Beautiful Data)
[3] âInformation Platforms as Dataspaces,â by Jeff Hammerbacher (in Beautiful Data)
Get Big Data Now: Current Perspectives from O'Reilly Radar now with the O’Reilly learning platform.
O’Reilly members experience books, live events, courses curated by job role, and more from O’Reilly and nearly 200 top publishers.

