Performance Tab
The first tool that you'll want to use in performance monitoring is found on the administration console. As you've probably noticed by now, each server has a Performance tab available. Click on it and you'll see something like Figure 9-1.
Figure 9-1. Performance Tab
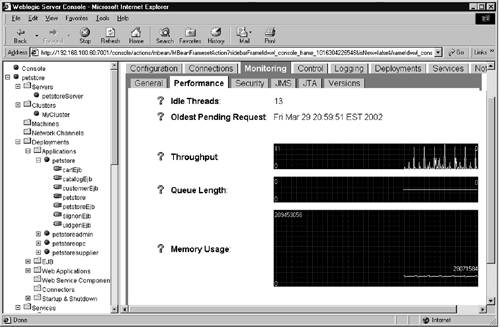
Five resources are graphically monitored on this tab[1]:
[1] It is perhaps worth noting that the server represented in Figure 9-1 is sitting on my desk and not accessible to anyone except me and perhaps an unusually dedicated and creative cracker. On a production server, you'd typically expect to see a bit more activity.
| Idle Threads | The number of threads on the server ... |
Get BEA WebLogic Server™ Administration Kit now with the O’Reilly learning platform.
O’Reilly members experience books, live events, courses curated by job role, and more from O’Reilly and nearly 200 top publishers.

