1 R BASICS
1.1 GETTING STARTED
Programming, writing code, is an integral part of modern data analysis. This book assumes some experience with a programming language. R is simply a high level programming language with several functions that perform specialized statistical analysis. Any R programmer may also write their own functions, but the focus of this book is using functions already in R and writing some basic code using these functions.
In this book, R code is always shaded. Related R output that follows is always underlined or, if extensive, presented in a table. Comments in R code follow the pound sign, #. When R functions are discussed in the text, they will be italicized.
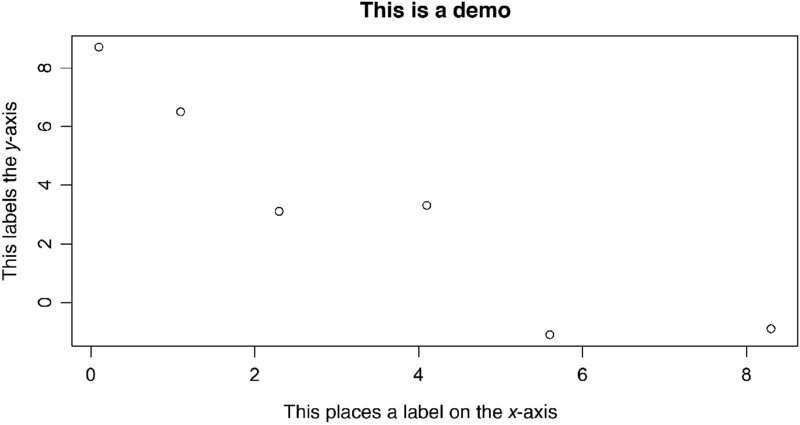
FIGURE 1.1 An example of a plot in R.
Some basic statistical analysis might involve inputting some values and performing some basic statistical analysis. Following the conventions already stated,
# this is a comment
x <- c(0.1,1.1,2.3,4.1, 5.6, 8.3) # create a vector of 6 values, these were just made up
y <- c(8.7, 6.5, 3.1, 3.3, −1.1, −0.9) #create a second vector
plot(x,y,xlab = “this places a label on the x axis”, ylab = “this labels the y axis”)
title(“this is a demo”)
# either “<-” or “=” can be used for assignments, but “<-” makes more sense.
# The reader should be aware that “=” and “<-” are not always interchangeable in R
(Figure 1.1).
The R code produces the data plotted in Figure 1.1 ...
Get Basic Data Analysis for Time Series with R now with the O’Reilly learning platform.
O’Reilly members experience books, live events, courses curated by job role, and more from O’Reilly and nearly 200 top publishers.

