Use Perl to create your very own local OLAP multidimensional cubes that you can explore using Microsoft’s Office Web Components (OWC).
Many hacks in this book show you where to get data and how to store it in a database. Other hacks show you how to answer specific questions using this data. But what if you don’t know exactly what question you want to ask? Oftentimes, so much data is available that you don’t know where to start. Other times, you just want to kind of poke around and let one question lead you on a journey to five more, as if you were on some kind of data safari.
You can do this with a database, writing multiple SQL queries to fetch different subsets of data summarized in different ways. However, this quickly becomes tedious, especially if you ask the same types of questions repeatedly. A data cube is a popular tool for working with summarized, aggregated data that lets you easily slice and dice the data. Logically, these structures are called cubes because they’re seen as 3D objects (or, more technically, as nD objects), where the qualitative things (such as teams, height, and season) that you typically like to group by are called dimensions, and the pre-aggregated data and any calculated expressions from them (such as hits and home runs), are seen as measures. This hack shows you how to use a cool tool from Microsoft to work with data cubes.
Well, let me back up. The Microsoft SQL Server product comes bundled with Microsoft SQL Server Analysis Services (it was called OLAP Services in earlier versions), which is devoted entirely to authoring, managing, and making “cube” data available online to connected network users. These network users can connect to this cube data using Microsoft Excel, as well as Microsoft OWC, which we shall see in a moment. This whole setup is, obviously, not within the price range of the casual home hobbyist, nor does it even make sense if money were no object because it’s geared toward a larger enterprise environment. But here’s the lesser-known fact: Microsoft made available a way that Excel (and other client products) can “cache” cube data offline. It created an MSOLAP data provider for its ActiveX Data Objects (ADO) library, which not only lets you connect to cube data on SQL Server through an ADO connection, but also allows you to create local cubes for offline use (via coding). The best part for us is that the originating data source does not need to be Microsoft SQL Server Analysis Services. You can use any ADO- or ODBC-compliant data source. So, we can use MySQL and connect through ODBC.
Once we create the cube, we will interact with it using Microsoft’s OWC located on a local web page that we save with a special extension, .hta, to turn it into a lightweight application. When you’ve got the basic cube framework in place, you can use it to analyze anything you want. For example, you can load play-by-play data and answer some deep questions. How do teams bat by inning? How do teams compare on OBP by batting position? What team’s 3-4-5 hitters are the most productive? Who had the most leadoff home runs? How many times did Frank Thomas fly out to left field versus right field? A cube provides a convenient interface for you to use.
Microsoft’s OWC consists of a few feature-rich, lightweight controls that provide enormous flexibility in enabling interactive content in web pages, and it is freely available to Microsoft Office users. In fact, if you have Microsoft Excel installed, you probably already have OWC installed. This hack assumes that you have Microsoft Office XP installed (if you have either an earlier or a later version installed, you might have to make a few tweaks to get this hack to work, which I’ll explain later).
Warning
If you don’t have any version of Microsoft Office installed, this hack will not work for you. But there is some glimmer of hope. Take a look at the “Hacking the Hack” section of this hack. The freely available OpenOffice.org suite still promises to let you do some form of pivoting against MySQL, ODBC, and ADO data—just not local cubes—using the Calc program’s DataPilot feature. It’s just not as sophisticated or mature as Microsoft’s pivot tables.
Now, back to the program. If you have Microsoft Office installed but you don’t have (or you’re not sure if you have) the OWC installed, you can either install them from your Microsoft Office install CD or download the most recent patches from Microsoft’s web site, depending on which version you have:
- Office 2000
Look for MSOWC.MSI on your Microsoft Office CD.
- Office XP
Search Google for “OWC10.exe Web Components.”
- Office 2003
Search Google for “OWC11.exe Web Components.”
Finally, make sure you have an ODBC driver installed for MySQL [Hack #33] .
Ah, finally! Now, for the good stuff. There are three steps to this hack: define the structure of our multidimensional cube, turn these blueprints into some physical cube file using Perl, and provide an interface.
Sadly, there isn’t a lot of good documentation out there (I managed to find one source: http://www.localcubetask.com/createwithvb.htm). So, hopefully, this will serve as some form of template for you. Tuck this pseudo-SQL-looking code into a text file; I named it define_batting_cube.txt and placed it in C:\baseball_data directory.
The key pieces of information are SOURCE_DSN=bbdatabank (which points to the ODBC DSN that we created earlier) and the DATA SOURCE = C:\baseball_data\batting.cub setting, which is completely counterintuitive because it doesn’t refer to our “source” but, rather, to our “destination” file. Don’t ask me!
	PROVIDER=MSOLAP.2;
	DATA SOURCE=C:\baseball_data\batting.cub;
	SOURCE_DSN=bbdatabank;
	CREATECUBE=CREATE CUBE [MyLocalCube] (

	 DIMENSION [Seasons],
	   LEVEL [All] TYPE ALL,
	   LEVEL [Year],

	 DIMENSION [Teams],
	   LEVEL [All] TYPE ALL,
	   LEVEL [League],
	   LEVEL [Team],

	 DIMENSION [Players],
	   LEVEL [ALL] TYPE ALL,
	   LEVEL [Player],
	    PROPERTY [PlayerID] CAPTION [PlayerID],
	    PROPERTY [HeightWeight] CAPTION [Height/Weight],

	 MEASURE [G]   Function SUM,
	 MEASURE [AB]  Function SUM,
	 MEASURE [H]   Function SUM,
	 MEASURE [HR]  Function SUM,
	 MEASURE [RBI] Function SUM,

	 COMMAND (
	  CREATE MEMBER [MyLocalCube].[MEASURES].[AVG]
	   AS 'IIF([MEASURES].[AB] > 0, [MEASURES].[H] / [MEASURES].[AB], NULL)',
	   FORMAT_STRING = '0.000'
	  )
	);
	INSERTINTO=INSERT INTO [MyLocalCube]
	(
	 [Seasons].[Year],
	 [Teams]  .[League],
	 [Teams]  .[Team],
	 [Players].[Player].KEY,
	 [Players].[Player].NAME,
	 [Players].[Player].PlayerID,
	 [Players].[Player].HeightWeight,
	 [G],
	 [AB],
	 [H],
	 [HR],
	 [RBI]
	)
	SELECT
	 B.YearID AS Year,
	 B.lgID AS League,
	 B.teamID AS Team,
	 B.playerID AS Player_KEY,
	 B.playerID AS PlayerID,
	 CONCAT(M.nameLast,', ', M.nameFirst) AS Player_NAME,
	 CONCAT(M.height, '", ', M.weight, ' lbs') AS HeightWeight,
	 B.G,
	 B.AB,
	 B.H,
	 B.HR,
	 B.RBI

	FROM
	 batting B, master M

	WHERE
	 B.playerID = M.playerID
Now that we have defined the code to create a local cube from our MySQL data, we’ll use Perl to pass it into the Microsoft ADO object library, which will know what to do with it. I call this file make_local_cube.pl:
	#!/usr/bin/perl

	# WE WILL BE USING THE ADO OBJECT LIBRARY
	use Win32::OLE;
	use Win32::OLE::Const 'Microsoft ActiveX Data Objects';
	Win32::OLE->Initialize(Win32::OLE::COINIT_OLEINITIALIZE);

	# WHAT FILE HAS THE CREATE CUBE CODE?
	$QueryFile = $ARGV[0];

	# READ IN THE SYNTAX FROM THIS FILE
	open INFILE, "$QueryFile" or die "can't open input file $QueryFile:$!\n";
	$QueryText = '';
	print "Reading contents of $QueryFile…\n";
	while (<INFILE>) {$QueryText = $QueryText . $_;}
	close INFILE;

	# INITIATE A NEW ADODB CONNECTION AND PASS IN THE CREATE CUBE CODE
	print "Creating cube …\n";
	my $Conn = Win32::OLE->new('ADODB.Connection');
	$Conn->Open($QueryText);

	# IF THERE WAS AN ERROR, ALERT THE USER THAT IT FAILED
	if (Win32::OLE->LastError) {die Win32::OLE->LastError(), "\n";}

	# CLOSE THE CONNECTION (IF EVEN STILL OPEN)
	$Conn->Close;

	# ELSE, PARSE OUT THE NAME OF THE CREATED .CUB FILE
	$QueryText =~ /DATA SOURCE=(.*);/;
	$CubeFile = $1;
print "$CubeFile created!\n";Last, but not least, we need some application to interact with the .cub file we created. A very lightweight local web application should work. Save the following code in a file called cube_viewer.hta:
	<hta:application showintaskbar="YES" windowstate="MAXIMIZE"/>

	<html>

	<head>

	<title>Interactive Cube Viewer</title>

	<script language="VBScript">

	Sub connectToCube(strFilename)

	 'CONNECT TO THE DESIRED CUB FILE
	 objPivot.ConnectionString = "provider=MSOLAP.2;Data Source=" & strFilename
	 objPivot.DataMember = "MyLocalCube"
	 objPivot.ActiveView.TitleBar.Caption = strFilename

	 'ONLY VISIBLE MEMBERS GO INTO TOTALS
	 objPivot.ActiveView.TotalAllMembers = False

	 'SET DEFAULT PIVOT TABLE OPTIONS
	 objPivot.MaxWidth  = screen.availWidth - 50
	 objPivot.MaxHeight = screen.availHeight - 175
	 objPivot.AllowDetails = False
	 objPivot.DisplayFieldList = True
	 objPivot.DisplayToolbar  = True

	 'FORMAT PIVOT FIELDS
	 Set ptConstants = objPivot.Constants
	 for each fs in objPivot.ActiveView.FieldSets
	   for each f in fs.fields

	     'SET SUBTOTALS TO BOLD
	     f.SubtotalLabelFont.bold = True
	     f.SubtotalFont.bold = True

	     'TURN MEMBER PROPERTIES INTO MOUSE-OVER SCREEN TIPS
	     for each p in f.MemberProperties
	       p.DisplayIn = ptConstants.plDisplayPropertyInScreenTip
	     next
	   next
	 Next

	 'HANDCUFF THE GRAPH TO THE PIVOT TABLE
	 objChart.DataSource = objPivot

	 'SET DEFAULT GRAPH OPTIONS
	 objChart.HasMultipleCharts = False
	 objChart.Width = screen.availWidth - 150
	 objChart.Height = screen.availHeight - 225
	 objChart.AllowPropertyToolbox = True
	 objChart.DisplayToolbar = True
	 objChart.DisplayFieldList = True
	 objChart.HasChartSpaceTitle = True
	 objChart.HasChartSpaceLegend = True
	 objChart.ChartSpaceTitle.Caption = strCubename
	 objChart.PlotAllAggregates = objChart.Constants.chPlotAggregatesSeries

	 'CHANGE THE VIEW BACK TO PIVOT TABLE VIEW
	 PickView (1)

	End Sub

	Sub PickView(opt)

	 'HIDE/SHOW THE DESIRED OBJECT
	 If (opt = 1) Then
	    table_area.style.display = "block"
	    chart_area.style.display = "none"
	 Else
	    table_area.style.display = "none"
	    chart_area.style.display = "block"
	 End If

	End Sub

	</script>

	</head>

	<body bgcolor="rgb(240,240,240)" onload="connectToCube(cboCubeChooser.value)">

	<select id="cboCubeChooser" onchange="connectToCube(me.value)">
	<option value="C:\baseball_data\batting.cub" SELECTED>Batting</option>
	<option value="C:\baseball_data\pitching.cub">Pitching</option>
	</select>

	<a href="#" onclick="PickView(1)">View As Table</a> |
	<a href="#" onclick="PickView(2)">View As Chart</a>
	<hr>

	<div id="table_area" style="display: block">
	  <object id="objPivot"
	    classid="clsid:0002E552-0000-0000-C000-000000000046">
	  </object>
	</div>

	<div id="chart_area" style="display: none">
	  <object id="objChart"
	    classid="clsid:0002E556-0000-0000-C000-000000000046">
	  </object>
	</div>

	</body>

	</html>
To run the hack, first you need to execute the Perl script to create the cube’s data, and then open the cube viewer application. To perform the first step, call the make_local_cube.pl script and pass in the name of the file that has the CREATE CUBE syntax in it. Of course, nothing is stopping you from creating only this one. You can define many different cubes for different data sources and pass them into this reusable script (see Figures 4-21 and 4-22).
	C:\baseball_data>perl make_local_cube.pl "define_batting_cube.txt"
	Reading contents of define_batting_cube.txt …
	Creating cube …
	C:\baseball_data\batting.cub created!
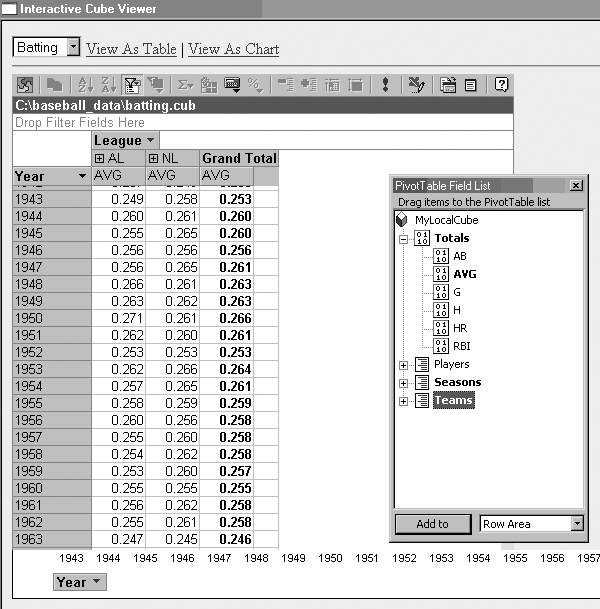
Now for the fun part! To view the cube, open the C:\baseball_data\cube_viewer.hta application in Internet Explorer and, voilà, our data is alive! Just click and drag stuff around. You can also right-click on this and that to change fonts and number formats. Play around with it—you can’t hurt anything. So now, let’s see how easy it is to compare league batting averages between AL and NL.
The OWC pivot table object is very flexible. You don’t have to connect to a multidimensional cube (I simply prefer it because the pivot table object handles cube data a little better, and you can “pass in” extra information, such as rollover caption properties). But you certainly can connect to, for instance, the Baseball DataBank database stored in MySQL directly using ODBC. Simply replace the connection string information for .cub files:
	   objPivot.ConnectionString = "provider=MSOLAP.2;Data
	Source=C:\baseball_data\batting.cub"

	   objPivot.DataMember = "MyLocalCube"
to the following:
	   objPivot.ConnectionString = "PROVIDER=MSDASQL.1;DRIVER={MySQL ODBC 3.51
	Driver};SERVER=localhost;DATABASE=bbdatabank;UID=username;PWD=password;"
	   objPivot.CommandText = "select * from batting;"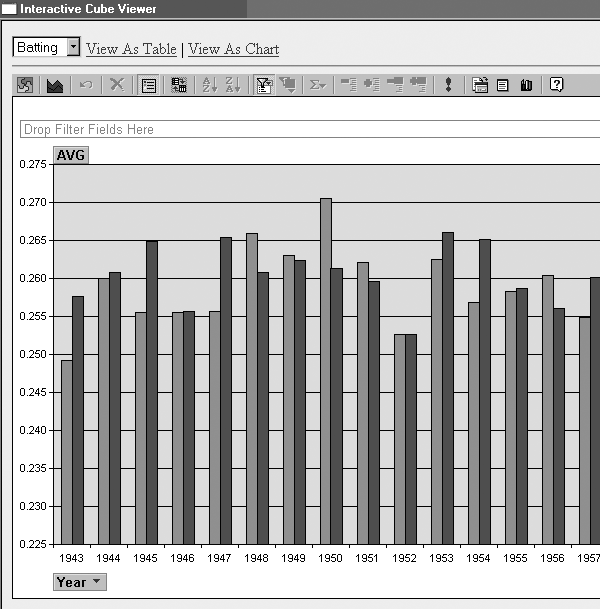
You also certainly can do your slicing and dicing from within Microsoft Excel (which I’m sure is what many people prefer to do). One advantage of doing that is you then have the full program at your disposal (if you’re completely against Internet Explorer; also, you won’t have to worry about any quirky OWC compatibility issues). And one really nice thing about Excel is that it’s very easy to create a new pivot table and connect it to an external data source, be it live data via ODBC or a local .cub file you have stored. All you have to do is run the Pivot Table wizard in the Data menu and let it walk you through the process.
—Tom Dierickx
Get Baseball Hacks now with the O’Reilly learning platform.
O’Reilly members experience books, live events, courses curated by job role, and more from O’Reilly and nearly 200 top publishers.

