COMPUTER EXERCISES
5.5. Design a 3-band equalizer using the peaking filter equations of Chapter 2. The center frequencies should correspond to the auditory filters (see Table 5.1) at center frequencies 450 Hz, 1000 Hz, and 2500 Hz. Compute the Q-factors associated with each of these filters using, Q = f0/BW, where f0 is the center frequency and BW is the filter bandwidth (obtain from Table 5.1). Choose g = 5dB for all the filters. Give the frequency response of the 3-band equalizer in terms of Bark scale.
5.6. Write a program to plot the absolute threshold of hearing in quiet Eq. (5.1). Give a plot in terms of a linear Hz scale.
5.7. Use the program of Problem 5.6 and plot the absolute threshold of hearing in a Bark scale.
5.8. Generate four sinusoids with frequencies, 400 Hz, 1000 Hz, 2500 Hz, and 6000 Hz; fs = 44.1 kHz. Obtain s(n) by adding these individual sinusoids as follows,
![]()
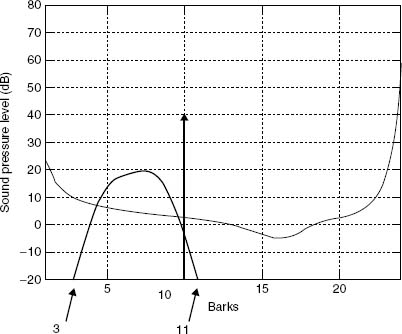
Figure 5.14. Perceptual bit-allocation, Problem 5.4.
Give power spectrum plots of s(n) (in dB) in terms of a Bark scale and in terms of a linear Hz scale. List the Bark-band numbers where the four peaks are located. (Hint: see Table 5.1 for the bark band numbers.)
5.9. Extend the above problem and give the power spectrum plot in dB SPL. See Section 5.7.1 for details. Also include the absolute threshold ...
Get Audio Signal Processing and Coding now with the O’Reilly learning platform.
O’Reilly members experience books, live events, courses curated by job role, and more from O’Reilly and nearly 200 top publishers.

