PROBLEMS
5.1. Describe the difference between a Mel scale and a Bark scale. Give tables and itemize side-by-side the center frequencies and bandwidth for 0–5 kHz. Describe how the two different scales are constructed.
5.2. In Figure 5.12, the solid line indicates the just noticeable distortion (JND) curve and the dotted line indicates the absolute threshold in quiet. State which of the tones A, B, C, or D would be audible and which ones are likely to be masked. Explain.
5.3. In Figure 5.13, state whether tone B would be masked by tone A. Explain. Also indicate whether tone C would mask the narrow-band noise. Give reasons.
5.4. In Figure 5.14, the solid line indicates the JND curve obtained from the psychoacoustic model 1. A broadband noise component is shown that spans from 3 to 11 Barks and a tone is present at 10 Barks. Sketch the portions of the noise and the tone that could be considered perceptually relevant.
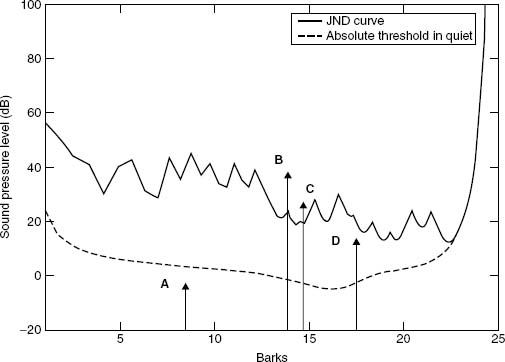
Figure 5.12. JND curve for Problem 5.2.
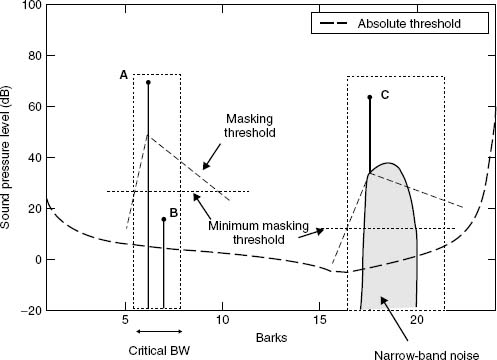
Figure 5.13. Masking experiment, Problem 5.3.
Get Audio Signal Processing and Coding now with the O’Reilly learning platform.
O’Reilly members experience books, live events, courses curated by job role, and more from O’Reilly and nearly 200 top publishers.

