2.2 SPECTRA OF ANALOG SIGNALS
The frequency spectrum of an analog signal is described in terms of the continuous Fourier transform (CFT). The CFT of a continuous-time signal, x(t), is given by
![]()
where ω is the frequency in radians per second (rad/s). Note that ω = 2πf, where f is the frequency in Hz. The complex-valued function, X(ω), describes the CFT magnitude and phase spectrum of the signal. The inverse CFT is given by
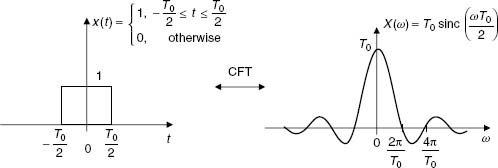
Figure 2.1. The pulse-sinc CFT pair.
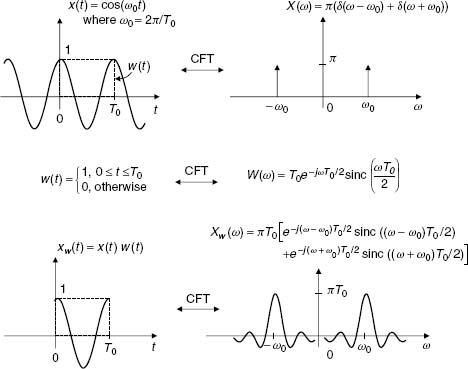
Figure 2.2. CFT of a sinusoid and a truncated sinusoid.
![]()
The inverse CFT is also known as the synthesis formula because it describes the time-domain signal, x(t), in terms of complex sinusoids. In CFT theory, x(t) and X(ω) are called a transform pair, i.e.,
![]()
The pulse-sinc pair shown in Figure 2.1 is useful in explaining the effects of time-domain truncation on the spectra. For example, when a sinusoid is truncated then there is loss of resolution and spectral leakage as shown in Figure 2.2.
In real-life signal processing, all signals ...
Get Audio Signal Processing and Coding now with the O’Reilly learning platform.
O’Reilly members experience books, live events, courses curated by job role, and more from O’Reilly and nearly 200 top publishers.

