The network dev tools in Chrome are very useful. They provide a good visualization of the request timings, and you can throttle the connection to see how it behaves over various different Internet connections. This is particularly important for mobile devices.
A selection of network requests from the Chrome dev tools are shown in the following screenshot. Additional columns are available if you right-click on the headings bar:
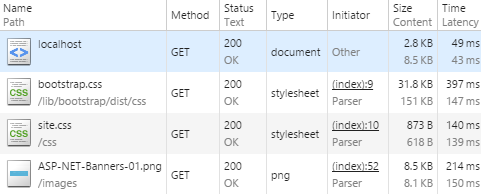
You can disable the cache with a simple checkbox so that the browser will always load assets fresh from your web server. You can also click on a resource for more information, and the Timing tab is very useful ...

