10.1. Uncovering Page-Level Problems
Problem
You want to find the source of a problem that appears to be associated with a particular page of your application, such as a page that completes its operations more slowly than desired.
Solution
Enable page-level tracing for the page in question by
setting the Trace
attribute of the @
Page
directive in the .aspx file to
"true" and then using
Trace.Write (or Trace.Warn)
statements as warranted in your code-behind to write trace
information to the trace output.
Example 10-1 through Example 10-3 show the code we’ve written
to illustrate this solution. Example 10-1 shows the
.aspx file for a typical ASP.NET page. The
code-behind class for the page appears in Example 10-2 (VB) and Example 10-3 (C#). By
running the page and analyzing the trace sequence, you can see how
long certain key operations are taking. The output with the trace
sequence is shown in Figure 10-1.
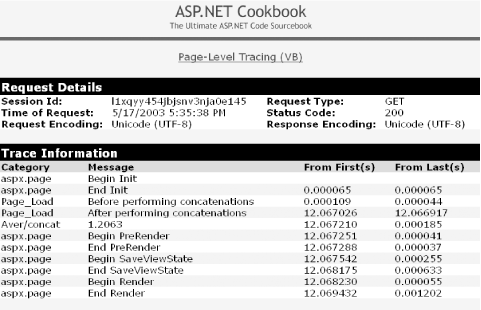
Figure 10-1. :Sample tracing output
Discussion
Tracing tracks and presents
the execution details about an HTTP request. The
TraceContext class is actually where ASP.NET
stores information about an HTTP request and its trace information.
You access the TraceContext class through the
Page.Trace property of an ASP.NET page. To enable
tracing for the page, be sure to set the Trace
attribute of the @
Page
directive in the .aspx file to
"true“, as shown in Example 10-1.
The TraceContext class ...
Get ASP.NET Cookbook now with the O’Reilly learning platform.
O’Reilly members experience books, live events, courses curated by job role, and more from O’Reilly and nearly 200 top publishers.

