In April 2011, United States Special Forces descended on the hideout of Osama bin Laden, leader of the terrorist group al-Qaida. The ensuing raid killed bin Laden after over a decade of living in hiding and directing attacks by his followers. So who knew where he was located?
The answer may surprise you: we all did.
According to Kalev Leetaru, a researcher at the University of Illinois at Urbana-Champaign, an analysis of public news articles[1] about bin Laden pinpointed his location within 200 kilometers in diameter. In a very real sense, one of the world’s most secretive hiding places may have ultimately revealed itself from the mosaic of individual data points. Each journalist had an opinion about the location, and all opinions together formed a true answer. The catch here: no survey was conducted, and no journalist was actually asked. They revealed their views about bin Laden’s whereabouts through their articles. It is the power of public and unstructured data. The outcome is depicted in Figure 1.
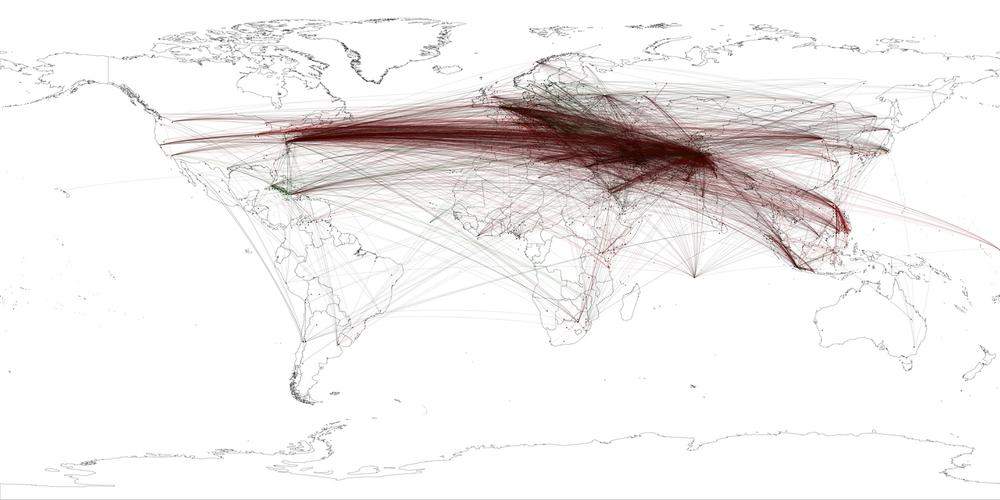
Figure 1. Geocoded social media articles describe the location of Osama bin Laden. (Courtesy of Kalev Leetaru.)
Most likely the US forces did not rely on crowdsourced wisdom like this. We know today that US governement agencies like the NSA are tapping into all kinds of different data sources, from spying on the phones of top-level politicians to tapping into everyone’s communication from email providers. However, the principle is the same: actionable intelligence was derived from an aggregation of individual, and in this case, seemingly random, data points.
Herein lies the promise of what we call big data. It has become one of the trendiest digital buzzwords of the new millenium. It involves gathering business intelligence from the heretofore forbidden territory of data sets that are too large to curate or maintain as databases, often encompassing terabytes or even petabytes of information. One of its most compelling forms today is the use of social media data, a mirror that reveals what each and every one of us wants, needs, and prefers. This data, enriched with our clicks in the Internet, our mobile phone usage, and our location data, will create amazing insights about us and our future.
We, the authors, have for more than half a century been helping governments and NGOs draw conclusions out of big data, especially social media data. We built a company called Fisheye Analytics that offers a software as a service that analyzes media data around the world. We analyze about 70 TB of textual data monthly for our clients. But we have learned as well that it is not the size that matters, but rather the right question and the right data.
In this book we want to serve you as well and show you on a case-by-case basis how to gain insights out of data. It is not about data as such. It is not about size as such. It is about the value that data can bring.
Data has always had strategic value, but with the magnitude of data available today and our capability to process it has become a new form of asset class. In a very real sense, data is now the new equivalent of oil or gold. And today we are seeing a data boom rivaling the Texas oil boom of the 20th century or the San Francisco gold rush of the 1800s. It has spawned an entire industry, and has attracted a great deal of business press in recent years.
This new asset class of big data is commonly described by what we call “three V’s.”[2] Big data is anything that is high volume and high velocity and includes a high variety of information. Next to those traditional three “V’s,” we add would like to add a fourth “V,” value. This is what everyone is looking for, and this is why big data today gets so much attention. Big data can take the form of structured data, such as financial transactions, or unstructured data such as photographs or blog posts. It can be crowdsourced, as in the case of Osama bin Laden, or individually gathered like any insurance company has done for a long time. Paradoxically this value of big data is normally represented in small data. Such as “Yes/No” on the question, “Shall I buy this company or not?” or on a geolocation code for the whereabouts of Osama bin Laden. The quest for value is the quest to reduce big data so that it becomes “valuable” data.
Big data has also been fueled by one of the biggest trends of the 21st century: social media. Our collective discussions, comments, likes, dislikes, and networks of social connections are now all data, and their scale is massive. If all Facebook users were a country, it would be one of the largest in the world with over a billion active users, while Twitter users send millions of tweets per month as of early 2013. It is now the first time that we can study human interaction and human discussions in such depth. Each tweep (Twitter user) or each user in Sina Weibo[3] leaves a trail of publicly accessible data behind. But also our private communication on Facebook or Qzone[4] can create great insights: What did we search for? What did we read? Where did we go? Who do we associate with? What do we eat? What do we purchase? In short, any imaginable human interaction can be found and studied on the social networks. If we can data mine all that information, the results seem to be limitless. It seems even possible that we can find where Osama bin Laden may be hiding. Thus social media data will kill every secret.
At the same time, like every other trend in technology in our lifetime, there is a great deal of hype surrounding big data and social media. At the onset of social media analytics, people believed that social media could be used to convince anyone of anything if it was just analyzed correctly. That is obviously wrong. Even the best predictive analytics cannot save the wrong product. In other instances, social media were seen as the magic weapon for marketers to create the same “viral”[5] hype around their products as there was around social media itself. We will see later in this book why this has not come true. The run on predictive analytics and social media measurement today is similar to that of the run on websites, when those who felt that having a website was a guaranteed ticket to success back in 1996. Meanwhile, the basics of big data and social media analytics will become enabling technologies for many of us, just like the telephone and the World Wide Web.
Big data has arrived. It is changing our lives and changing the way we do business. But succeeding with big data will require more than just data. Just as the US troops needed to decide whether to use crowdsourced social media data or internal data, businesses will need to decide what data to use. The data each business owns might be as different as the businesses themselves, from log files, to GPS data, to customer or machine to machine data, and each one will need to select its data source. Moreover, it will require the right way of dissecting and then in turn analyzing the data with the right analytics. It will require knowing how to separate valuable information from hype. That is the purpose of this book: to teach you the basic principles of what research has actually shown to work, and to help you become one of the businesses that will use big data to succeed.
The world of data is vast, and each business will need to look at its own data set. Throughout this book, we will use many examples of social media metrics, not because we believe that social media is the most promising data set to use for predictive analytics. Actually, with regards to social media, the opposite is true. Social media provide the most difficult data sets, as we will learn later. However, social media data is easily accessible to nearly everyone; and the principles, data structures, and lessons learned in this book can be easily transportable to your own personal data needs and availability. First, let’s explore how the promise of big data can impact your business.
The philosophy of the day is data-ism.
Data analytics proponents are promising a bright future that will change our lives. They promise that we can predict things we never knew before, from price points to military intelligence. And they are right. For example, in Santa Cruz, California, a software application predicts what locations and times of day are the most likely settings for crimes to occur.[6] Recently, police caught two women who were peering into cars, had outstanding warrants, and were carrying drugs. They had no idea that they were done in by a big-data application, which in turn has helped preempt several crimes. While predictive data has in fact been used for many years in police work, this is an example of it being used in real time.
Of course, predictive policing is just one example, and one of the more exotic ones, of how we can use the power of large data sets. Today we see data being used more and more in our world:
Google uses data to predict the next wave of influenza.
IBM uses data to optimize traffic flow in the city of Stockholm and to get the best possible air quality.
Zafu, 2Style4You, and others use self-collected body data to suggest clothes that will fit you best.
Dr. Jeffrey Brenner, a physician in New Jersey, uses medical billing data to map out hot spots where you can find his city’s most complex and costly healthcare cases, as part of a program to lower heathcare costs.
The National Center for Academic Transformation is using data mining to help understand which college students are more likely to succeed in which courses.
Insurance companies offer lower rates on car insurance if you place a GPS device voluntarily in your car. They use the data to predict whether you are going to have a car accident soon and then adjust your insurance policy accordingly.
Many retailers use data for product recommendations and targeted advertisements to the point that they know that you might be pregnant.
We are now living in a world where anything and everything can be measured. “Data” seems to be a new ideology. We are just at a beginning of a long journey where we will measure and analyze more and more information about everyone and everything in order to drive our businesses and our decisions.
This world has also become a source of concern. The consequences of this data on privacy and other areas of society are not yet known, and there are prominent critics such as Jaron Lanier, who asks people to not readily believe any result created by the “wisdom of the crowd.” Moreover, applications of data in policing or military intelligence have created a growing concern for privacy. At a time where US agencies even tap into the mobile phones of their closest allies to gather information, many users feel that governments as well as companies have crossed the line of what is acceptable. We will touch on some of those aspects throughout the book and will recommend that transparency as well as open data will be the main way to counter those worries.
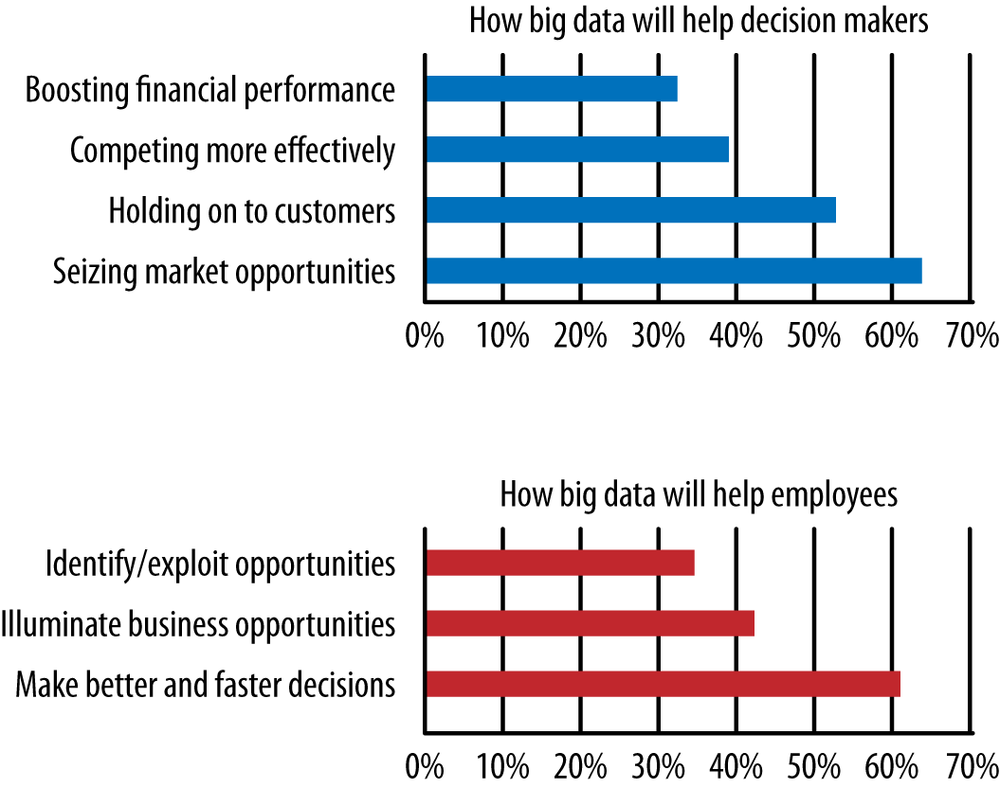
Despite those warnings and concerns, for many of us, “data driven” is the new management philosophy. The Economist Intelligence Unit[7] released survey data showing how people feel big data will help decision makers and employees alike, as shown in Figure 2. Roughly two-thirds feel it will help us find new market opportunities and make better decisions, nearly half feel it will help us compete better, and more than a third believe it will boost financial performance and exploit more opportunities.
But the promises are sometimes too much. Like any nascent technology, big data is being sold around a lot of ‘hype. If you were to believe it, the problems of the world—and your business—could be solved by simply increasing the size of your data set or surveying the latest tweets. It’s to the point that Chris Anderson (@chr1sa), at that time editor-in-chief of Wired Magazine, made the bold claim that we will reach “The End of Theory” if we just have enough data: “Google’s founding philosophy is that we don’t know why this page is better than that one: if the statistics of incoming links say it is, that’s good enough.”[9] The future is bright indeed, but it will never be that bright. In Chapter 9, we will discuss the differences between correation and causation and why it is and always be difficult to measure causation.
This book is designed to sift through the challenges and hype of big data. It will help you realize the fourth “V” of big data, value. Not the wisdom of the crowd nor “more data” by itself is the value. To find value in big data, one has to have right, well-formulated questions, the right methods, and the right data. Only then you will get the desired competitive advantage.
Data really powers everything that we do.
—Jeff Weiner[10] (@jeffweiner), LinkedIn
You might argue that you always wanted to be results oriented. As results are measurable, you had to also be data driven. Right? Also, predictive analytics does not seem to be anything particularily new, given that insurance companies have been using it for a long time. Thus why this sudden run on data and predictions? There are two main reasons for this increased focus:
There is more data publicly available.
The technology is there to process large amounts of data.
Let’s look at both of these factors.
Today, more and more, data has become the center of many discussions. It used to be that data was something hidden. Your insurance company would use data to calculate your policy by comparing your data with those of many peer groups, but this was highly confidential. Today Twitter gives out some parts of its 140 million tweets. StackOverflow regularly allows anyone to download complete answers to its programming questions. In addition to those companies, there are data markets and governments that offer access to census data and other data types.
The volume of this data also continues to grow, in some cases exponentially. As of 2011, the Library of Congress was collecting over 200 terabytes a month of information; and in its best months, over half a billion tweets are sent on Twitter.
In a sense, “big” in big data refers here to the first “V,” volume, the idea of lots of data. However, “big” in big data sometimes refers to high-velocity data, where fast decisions need to be made by taking in data within a few milliseconds or even microseconds. For example, with real-time bidding engines, the system has less than 25 milliseconds to react to a request from the ad server. The ad server gives data points such as, “We can show your ad to a person on that site from this IP range. How much are you willing to pay?” Thus the ad agency needs to crunch its own big data set in a few milliseconds to be able to answer. Another example of high-velocity data are the computers that trade stocks within a fraction of a millisecond. A new real-time world of data has emerged.
Sometimes the term big data is also used when structured and unstructured data are combined. It used to be that data scientists only looked at structured data. We will understand in Chapter 9 why this kind of data is much easier to deal with and build models around. Today, however, data often come in a variety of different fomats. We will learn throughout this book when and how unstructured data, such as the media data used to predict bin Laden’s location, is helpful. For example, one could crunch millions of unstructured tweets to figure out whether the weather in New York is nice. However, it is probably easier to just take a single data point from a weather website: sunny or not? In all this discussion on data, the fourth “V” is the forgotten one, but that is the reason we do data at all. Therefore in this book will focus on finding “value” in data.
The second reason for the hopes connected to predictive analytics is that today the technology exists to deal quickly (velocity) with large quantities (volume) of decentralized data in different formats (variety). In the past, predictive analytics worked by “loading” highly structured data into a big data warehouse and processing all of the data. This approach became more and more difficult and expensive. Today companies start to to deal with an unknown quantity of data that can be stored anywhere, in any quality and in any structure.
The technology underlying this is called Hadoop. Apache Hadoop, represented throught the logo of a yellow elephant, can be described as an open source ecosystem. Within this ecosystem one can query very large, distributed, and loosely structured data sets. With Hadoop you can do the following:
Instead of keeping all data in one database, you can work with distributed databases.
Instead of processing all data on one server, you can distribute the server processing to many systems, creating a much more powerful system.
Instead of using only structured content, you can also work with unstructured content.
Instead of “hindsight” results, businesses get nearly real-time results.
While symbolic of the big data movement, Hadoop is one of many tools now available for working with large distributed data sets, in addition to a veritable army of startup and consulting firms designed to help you make sense of big data from social media and other sources. These tools, and this data connectivity, are in turn creating a revolution.
This is not a technical book, and we will touch on technologies only to the extent that it is needed to understand the value of the data. Thus you will not learn the details of plumbing tools such as Hadoop or NoSQL. There are already good resources for these technologies, and once you understand your goal and aim for using big data, you can turn to these excellent books on plumbing:
Hadoop: The Definitive Guide, Third Edition, by Tom White (O’Reilly)
Programming Pig by Alan Gates (O’Reilly)
Getting Started with NoSQL by Gaurav Vaish (O’Reilly)
Gold requires mining and processing before it finds its way into our jewelry, electronics, and even the Fort Knox vault. Oil requires extraction and refinement before it becomes the gasoline that fuels our vehicles. Likewise, data requires collection, mining and, finally, analysis before we can realize its true value for businesses, governments, and individuals alike.
We have the data and we have the technology, so what is stopping all of us from getting to the fourth “V,” the value? What is stopping us from creating great algorithms that in turn will yield great data products or services? This book is all about the three major challenges we face in doing this and the way around them:
- Ask the right question.
Do you want to increase revenue? Then “how to get the most hits on YouTube” may be the wrong question to ask—these viewers may not be buyers. Good questions are measurable, actionable, and informed by domain knowledge. Asking the right question is the most important part of data analytics and an issue we will refer to frequently throughout this book.
- Use the right data.
Big data is called big data for a reason: you cannot always analyze it all directly. This means that choosing the right data (preferably structured and quantifiable data) together with the right sampling techniques is a critical factor in extracting knowledge from this data.
- Creating the right measure.
How do you turn data into predicted levels of purchasing intent—or the love of your life on a dating service? Metrics are the quantifiable drivers of your analysis, particularly with structured data, and data analytics pivots around them.
And of course, and equally important fourth step is to learn and take the right actions from these results.
Let’s start understanding these challenges by using two of the greatest successes in business use of big data as of this writing: the growth of Amazon.com as a marketplace, and the dominance of Google as a search engine of choice. The former built its success around a system of predictive recommendations, while the latter developed a data metric—Google’s PageRank algorithm—that made its search results much more relevant to the user. We discuss both of these cases in more detail later in this book.
Both of these successes are examples of asking the right question. Amazon has more products then any other retailer. No customer would find them easily. Thus Amazon’s question was, “Which product would fit which person?” Google’s challenge was similar: it tried to find the page you were looking for based on a few hints it got not only from your search but also from your location and more.
Helping you find the right question is a central aim of this book. However, please note that there is no defined and absolute way of finding the right question or if you have the question, finding the right metric. This very much depends on your business and your data. Short of a bulletproof, five step approach, we are using practical examples. We will show you how to formulate the specific question for typical parts of your business.
The book gives you a short introduction into the world of data, and more importantly, an introduction to the fourth “V,” the value. You will learn how to create your competitive edge. With practical examples, the book shows you the most common pitfalls and how to avoid them.
Finally, a common thread throughout each chapter is to learn from what data can teach you. Not just in the obvious sense of drawing conclusions from the information it contains, but also in the more subtle sense of knowing the limits of your data. Sometimes social media data can give you insight that you will find nowhere else, as it aggregates the digital footprints of a large crowd of people. Sometimes it may lack critical information, or even mislead you. For example, a YouTube view count may or may not correlate with purchasing intent, and a Twitter stream may measure the loudest partisan voices rather than the wisdom of the crowd. And sometimes this data will frankly lie to you to suit the agendas of others, a topic we will cover at length later in the book. Learning from data and from the nature of the data is a critical skill we hope to teach you.
Each and every organizational unit has its own unique questions, metrics, and data requirements. Sales worries about the top line, marketing would like to create reach for a brand message, and product development wants to know how to improve the product. Chapter by chapter, we look at different parts of an organization to show you how analysis of internal and external data can improve your business: just jump to your section, as the following section explains, for real-world examples.
Predictive analytics can figure out how to land on Mars, but not who will buy a Mars bar You should expect Big Data to have big impact ... but if you’re counting on it to make people much more predictable, you’re expecting too much.
This book has a clear purpose: to help you ask the right questions, measure the right data and the right content, and learn from the insights to uncover the fourth “V” of big data.
The book is particularly designed to give you the big picture that you need to leverage the wide range of tools out there—tools that will continue to evolve beyond the scope of this book.
Be aware that not every problem we are discussing in this book will be a big data problem; quite the opposite is the case. The problems will involve data and the measurement of the data. But will you need NoSQL or millisecond processing to address them? No. Our goal is to teach you where data can lead you first, before you scale data problems upward. We will use a lot of examples from social media analytics. Ultimately, we want to teach you how to work with a large and increasingly socially linked network of data to improve your business.
You do not necessarily have to read this book from Chapter 1 through the end to benefit from it. Depending on your level of expertise, there are a few ways you could navigate through this book, depending on how you’d describe yourself. Are you:
- A manager?
This is a book for you. You are looking for managerial advice for your own department such as marketing or PR, so you can jump right to the correct chapter. Then continue with either the rest or Chapter 6, where we explain how any metric can be abused. If your function or department was not present, do not despair, because we offer in Part II a small guide to design your own ask-measure-learn system.
- A data scientist?
The biggest issue within data science is the learn part. What does this data tell us? You have probably created dashboard after dashboard for your business partners but were wondering how to take this to the next level. Select the department that interests you most and start reading. This book contains many anecdotal stories and business cases on how to effectively learn by using data.
- Someone with no time?
If you’re somewhat in between the previous descriptions and don’t have much time, go to Chapter 2. Sales has the advantage of being easily measurable. Thus the questions, concepts, and metrics of this book are perhaps best described here.
- A first timer in data?
If you have not had a lot of exposure about statistical concepts and want to get some background, we urge you continue on to Part II. Here, we will go through a high-level overview through the main concepts of data analytics.
At the end of each chapter you will find some workbook questions. You can use those to discuss your discoveries with your colleagues, manager, or board. We also encourage you to share your own views and thoughts via Twitter (@askmeasurelearn) or on our LinkedIn or Facebook pages.
Here are the specifics of what we will cover in each chapter.
- Part I
Many companies focus on collecting data. But only once the data is reduced to a small insight will the fourth “V” of data be visible. The process to reduce big data to small data is always the same. First, ask the right question; second, measure the right things; and lastly, learn from the results. We have broken the chapters down by functions:
- Chapter 1
In a marketing context, social media can be used to create reach, brand awareness, or purchasing intent—and each of these are very different things that often require different approaches and different measures. Using case studies and examples, this chapter examines how social media can be used to reach or target potential customers and what factors influence its effectiveness. Perhaps more importantly, it explores the myth of the “influencer” and the viral spread of information.
- Chapter 2
What is the difference between reach and purchasing intent? For data-driven social commerce, purchasing intent is often driven by factors such as user-generated ratings and reviews, the capability to spread information about a product to a social network, and recommendations based on consumers’ online behavior. This chapter looks at the mechanics and technology of the kinds of recommendation systems that underlie online selling.
- Chapter 3
Public relations has two key functions: to distribute information and to warn people. Distributing information via social media offers the advantage of measurements to assess both individual networks and how central people are within their own network, while social media engagement metrics and network topology can help to anticipate critical situations beforehand. This chapter examines how PR has changed in an era of social media and big data.
- Chapter 4
We now have the capability to connect with our customers via social media and leverage their data footprint to derive everything from customer satisfaction levels to automated business intelligence. This chapter examines how customer care and CRM are evolving in the era of big data.
- Chapter 5
Social media and CRM data are potentially rich sources of market research data. Capabilities such as Facebook Graph hold the potential to enable us to know more about targeted groups of people than ever before, and some companies are leveraging their CRM data to make customer retention even more predictive. But does social media add valuable insight or noise to this process? This chapter examines the potential future for social CRM in business research.
- Chapter 6
You have a new friend. Is it a bot or not? This chapter looks at all the ways that fake results can impact your social media analytics in any of those functions, ranging from fake followers and tweets to “astroturfing,” a movement or campaign using automated social media identities. It also examines how the nature of social media itself can be misused to create fake virality, influence, and intention.
- Chapter 7
Can we predict whether you will succeed in college, who will win the next election, or what job is the best fit for you? This chapter examines the role of big data and social media in predictive analytics—the science of predicting future behavior from data. It is a summary providing a look at where the future of big data and social media analytics is taking us.
- Part II
Was your department not mentioned earlier? Was it mentioned, but your data problem is slightly different than what was discussed here? Or would you like to dig deeper into the mechanics of big data analytics? If yes, then this section is for you. Here, we will help you formulate your own ask-measure-learn system to dig into the data:
- Chapter 8
Big data analytics starts with asking the right question up front. Getting millions of views on YouTube or thousands of followers on Twitter could be extremely valuable or mean nothing at all, depending on what it is that is of particular interest: Do you want to find new customers? Do you want to increase revenue? Or do you just want to create brand awareness? Likewise, data mining approaches could easily yield either wheat or chaff, depending on the question you are asking and the measurements/data you use to answer it. This chapter examines how to create measurable and actionable questions to drive your efforts to understand what social media can tell you through big data.
- Chapter 9
You want to analyze data from tweets posted about an issue or use someone’s social network for targeted marketing. Are you choosing accurate data? Is it from the right context? Does it align with your strategic objectives? Are you confusing causation with correlation? This chapter discusses working with structured versus unstructured data, selecting the right features, and integrating this with the right question.
- Chapter 10
What you measure determines, in large part, what benefit you will obtain from social media and big data analytics. For example, “likes” on Facebook may have very different meanings for your objectives versus survey data, a Net Promoter Score, or other measures. This chapter explores examples and risks of common social media metrics, as well as the “measurement paradox,” where the act of measurement itself can affect what is being measured.
If we do our job well, you will begin looking at big data and social media analytics as a structured process that starts long before you put your finger to the keyboard, with clear business objectives for how you engage and leverage this data. Let’s start by learning on how to use data for marketing purposes.
Safari Books Online is an on-demand digital library that delivers expert content in both book and video form from the world’s leading authors in technology and business.
Technology professionals, software developers, web designers, and business and creative professionals use Safari Books Online as their primary resource for research, problem solving, learning, and certification training.
Safari Books Online offers a range of product mixes and pricing programs for organizations, government agencies, and individuals. Subscribers have access to thousands of books, training videos, and prepublication manuscripts in one fully searchable database from publishers like O’Reilly Media, Prentice Hall Professional, Addison-Wesley Professional, Microsoft Press, Sams, Que, Peachpit Press, Focal Press, Cisco Press, John Wiley & Sons, Syngress, Morgan Kaufmann, IBM Redbooks, Packt, Adobe Press, FT Press, Apress, Manning, New Riders, McGraw-Hill, Jones & Bartlett, Course Technology, and dozens more. For more information about Safari Books Online, please visit us online.
Please address comments and questions concerning this book to the publisher:
| O’Reilly Media, Inc. |
| 1005 Gravenstein Highway North |
| Sebastopol, CA 95472 |
| 800-998-9938 (in the United States or Canada) |
| 707-829-0515 (international or local) |
| 707-829-0104 (fax) |
We have a web page for this book, where we list errata, examples, and any additional information. You can access this page at http://oreil.ly/ask-measure-learn.
To comment or ask technical questions about this book, send email to bookquestions@oreilly.com.
For more information about our books, courses, conferences, and news, see our website at http://www.oreilly.com.
Find us on Facebook: http://facebook.com/oreilly
Follow us on Twitter: http://twitter.com/oreillymedia
Watch us on YouTube: http://www.youtube.com/oreillymedia
[1] Kalev Leetaru, “Supercomputer predicts revolution,” BBC Technology, September 2011, http://bbc.in/1kmj8VE.
[2] Diya Soubra, “The 3Vs that define Big Data,” Data Science Central, July 2012, http://bit.ly/KoNxlM.
[3] The Chinese Twitter equivalent.
[4] The Chinese Facebook and messenger platform, respectively.
[5] The word “viral” is actually misleading. We rather like to use the term “contagious,” as we will explain later in Virality versus Contagiousness.
[6] Erica Goode, “Sending the Police Before There’s a Crime,” New York Times, Aug. 2011, http://nyti.ms/KtmNR6.
[7] Economist Business Unit, “In search of insight and foresight Getting more out of big data,” 2013, http://bit.ly/1e5hFQA.
[8] Economist Business Unit, “In search of insight and foresight Getting more out of big data,” 2013, http://bit.ly/1e5hFQA.
[9] Chris Anderson, “The End of Theory: The Data Deluge Makes the Scientific Method Obsolete,” Wired Magazine, June 2008, http://bit.ly/1dLKMEE.
[10] Adam Lashinsky ( @adamlashinsky) , “Where LinkedIn is headed next”, CNN Money, June 2012, http://bit.ly/1fjJBNP.
[11] Steve Lohr, “The Origins of ‘Big Data’: An Etymological Detective Story,” New York Times, February 2013, http://nyti.ms/1f6YWk3.
Get Ask, Measure, Learn now with the O’Reilly learning platform.
O’Reilly members experience books, live events, courses curated by job role, and more from O’Reilly and nearly 200 top publishers.

