Let's consider the same training data we referred to earlier in this chapter. We have values for the independent variable, x, and corresponding values for the dependent variable, y. These values are plotted on a two-dimensional scatter plot. The goal is to draw a regression line through the training data so as to minimize the error of our predictions. The linear regression line with minimum error always passes the mean intercept for x and y values.
The following figure shows the least square method:
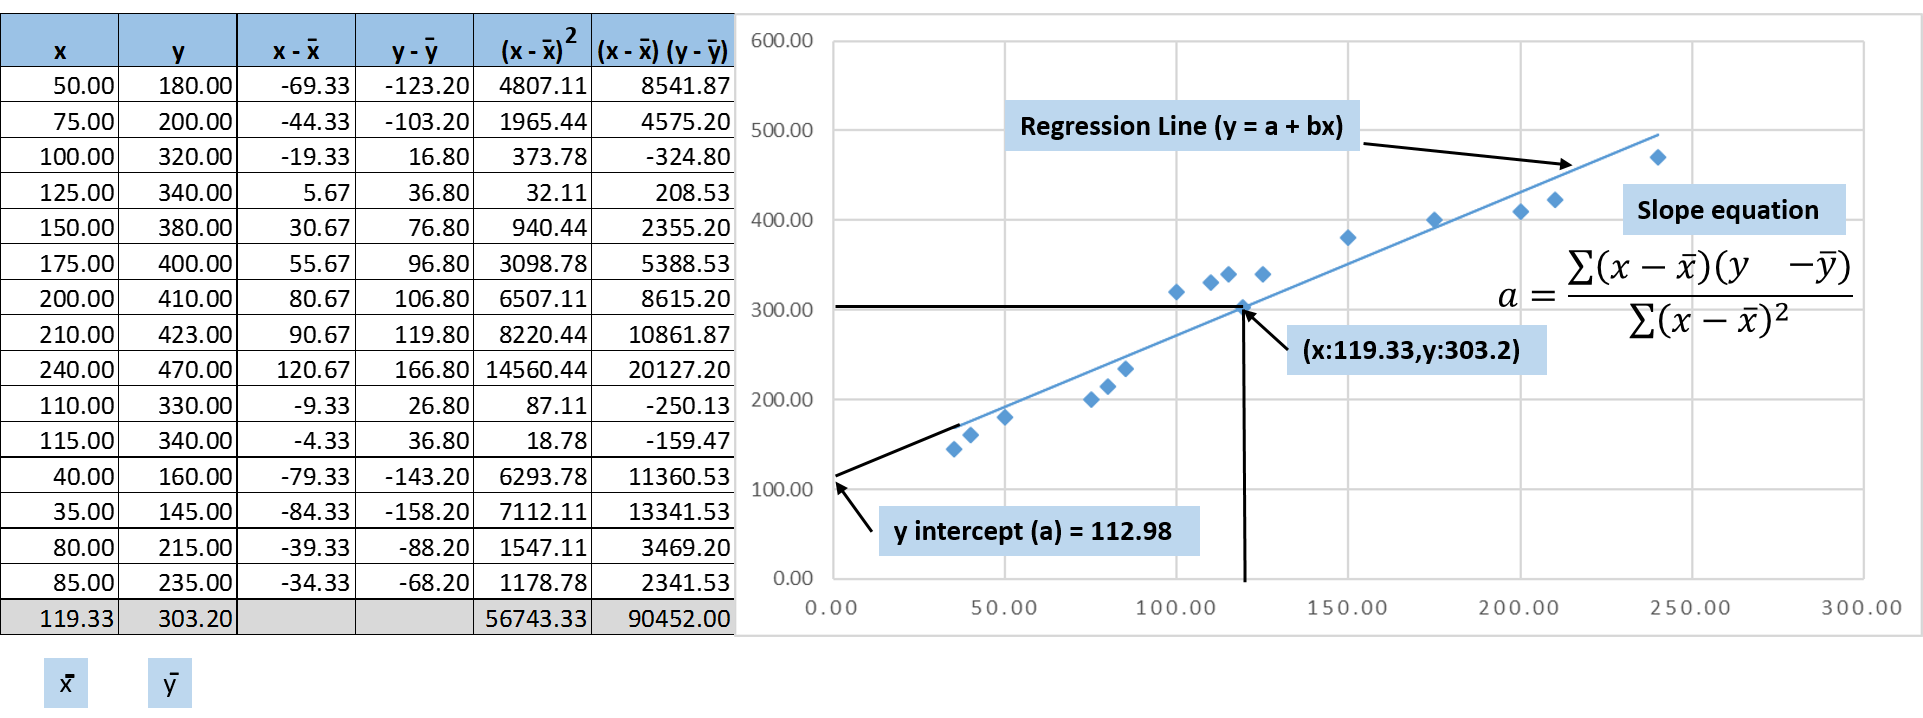
Figure 3.8 Least square method
The formula for calculating the y intercept is as follows:
The least square method calculates ...

