Take a look at the following 2D plots:
Plot 1:

Plot 2:
Plot 3:
Observations
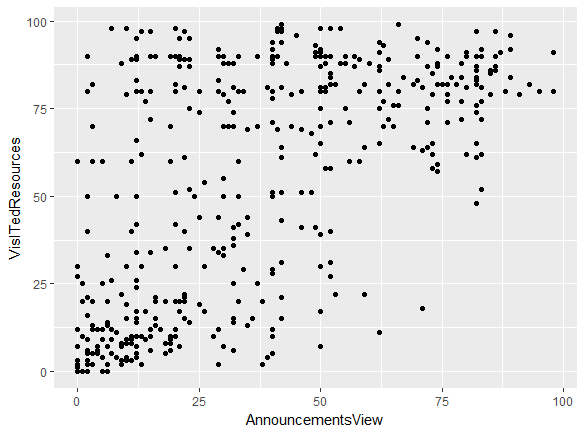
- I see that there is a weak positive correlation between AnnouncementsView and VisitedResources.
- Students in Math hardly visit resources; the median is the lowest, at about 12.5.
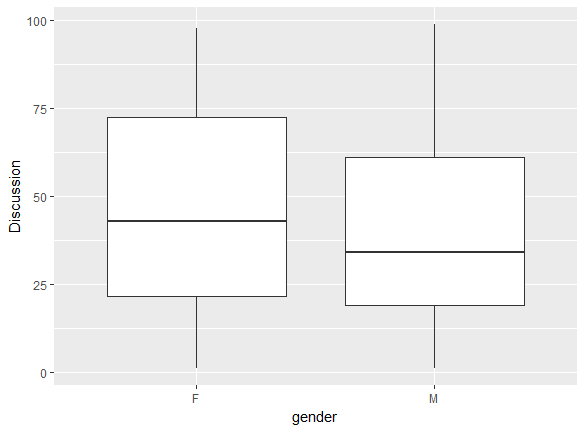
- Females participate in discussions more frequently, as their median and maximum are higher.
- People in Biology visit resources the most.
- The median number of discussions ...

