Scenario
Comparing the distribution of sales for different car models in a car company.
Aim
To use density plots to compare distributions.
Steps for Completion
- Use the dataset provided.
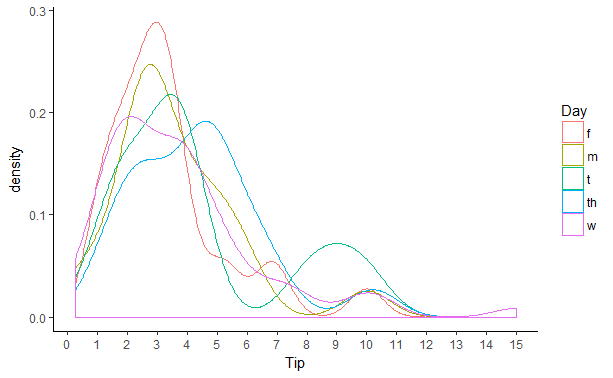
- Compare the TIP amount for various days.
- Superimpose all of the plots.
- Use the required command for the x-axis tick marks.
- Reproduce the plot that follows:
Refer to the complete code at: https://goo.gl/x4wQHG.

