Scenario
Here you want to look at the distribution of loan amounts for different credit grades.
Aim
To plot the loan amount for different credit grades using faceting.
Steps for Completion
- Use the loan data and plot a histogram.
- Use the required command to plot the loan data.
- Change the default options for facet_wrap.
Outcome
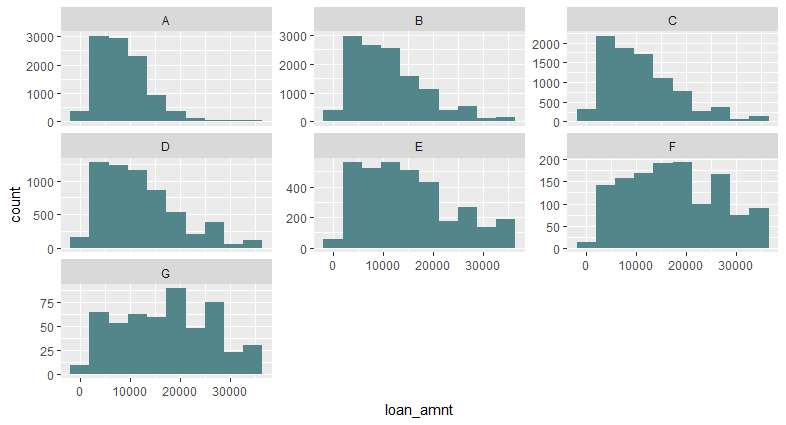
Take a look at the following outcome plots, plot 1:
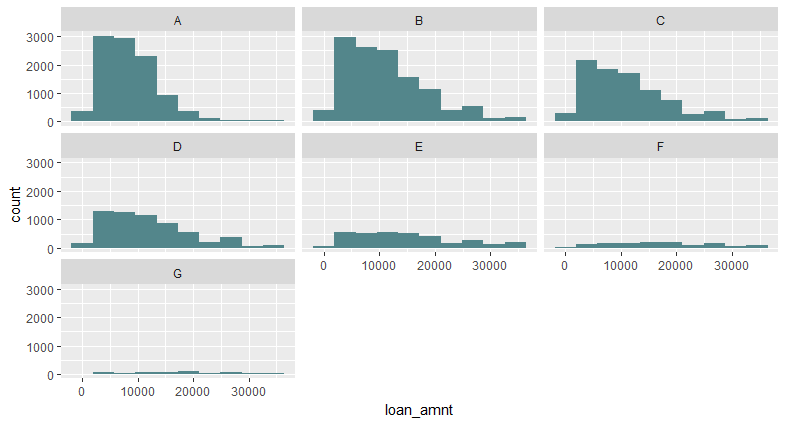
Plot 2: