In this section, we'll plot subsets of data as separate subplots. Let's begin by implementing the following steps:
- Use the gapminder.csv dataset.
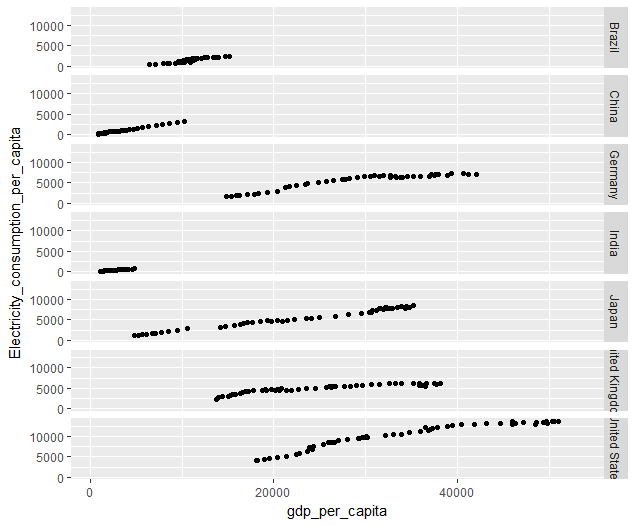
- Make a scatter plot of Electricity_consumption_per_capita versus gdp_per_capita:
p <- ggplot (df, aes (x=gdp_per_capita, y=Electricity_consumption_per_capita)) + geom_point ()
- Use facet_grid() to specify the variables to split upon. We will need to plot the electricity consumption versus GDP separately for each country. So, our split variable will be Country:
p + facet_grid(Country ~ .)
Take a look at the following output scatter plot:
- You can also arrange the panels ...

