In this section, we will use the built-in datasets to investigate the relationships between continuous variables, such as temperature and airquality. We'll explore and understand the datasets available in R.
Let's begin by executing the following steps:
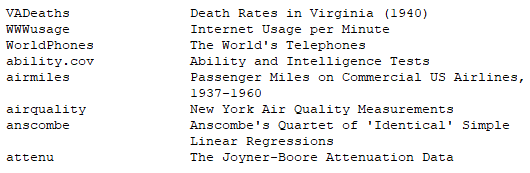
- Type data() in the command line to list the datasets available in R. You should see something like the following:
- Choose the following datasets: mtcars, air quality, rock, and sleep.
The number of levels only applies to factor data.
- List two variables of each type, the dataset names, and the other columns of this table.
- To view the data type, use the str command (for ...

