Simulation of Distribution Densities for Areas Enveloped by Above-Threshold or Below-Threshold Excursions of Gaussian and Rayleigh Random Process Curves
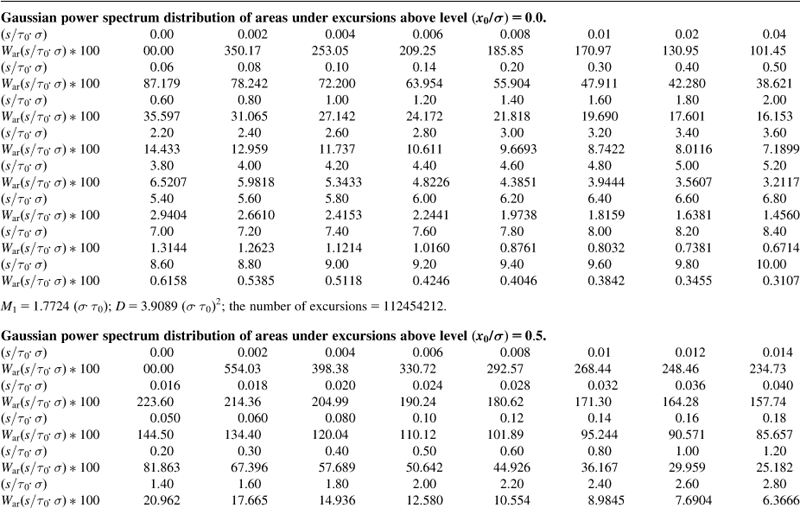
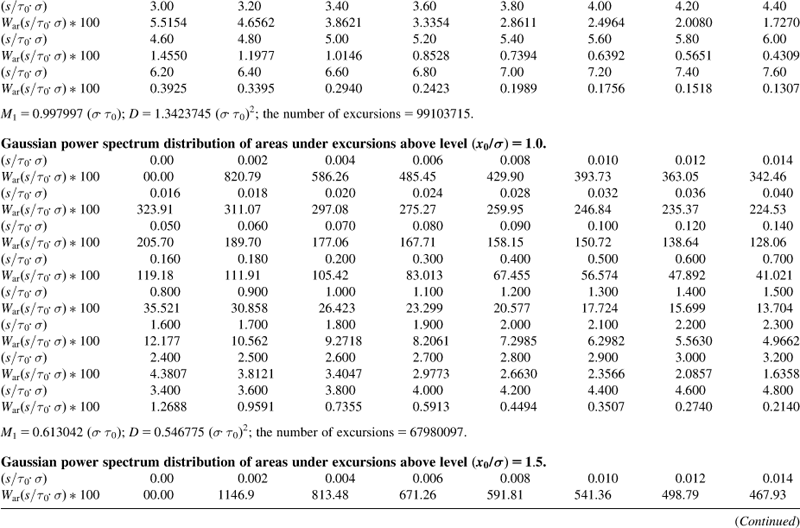
Table A3.1 shows the distribution density values obtained by simulation for areas under the curves that represent excursions of a Gaussian random process with a Gaussian power spectrum above the set standardized threshold level. The threshold level was gradually increased from 0 to 3 in 0.5 incremental steps.
Table A3.1
Gaussian Random Process
The data presented in Table A3.2 are ...
Get Applications of Random Process Excursion Analysis now with the O’Reilly learning platform.
O’Reilly members experience books, live events, courses curated by job role, and more from O’Reilly and nearly 200 top publishers.

