Profiling with Hierarchy Viewer
Hierarchy Viewer provides a powerful profiler to analyze and optimize the application. To proceed with the profiling, click the ![]() icon, Profile Node. If the hierarchy of your view is quite large, it might take some time until it is initialized.
icon, Profile Node. If the hierarchy of your view is quite large, it might take some time until it is initialized.
At this point, all the views in your hierarchy will get three dots:
- The left dot represents the Draw process of the rendering pipeline
- The middle dot represents the Layout phase
- The right dot represents the Execute phase
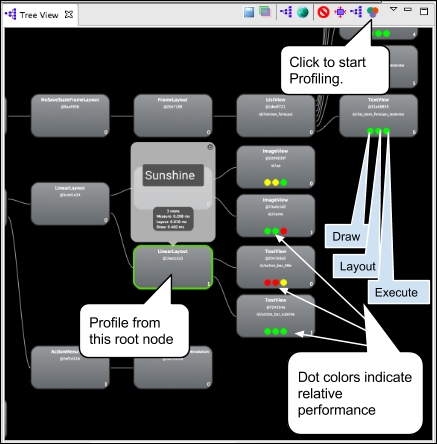
Each dot color within a view has a different meaning:
- A green ...
Get Android High Performance Programming now with the O’Reilly learning platform.
O’Reilly members experience books, live events, courses curated by job role, and more from O’Reilly and nearly 200 top publishers.

