2.8 Seasonal Models
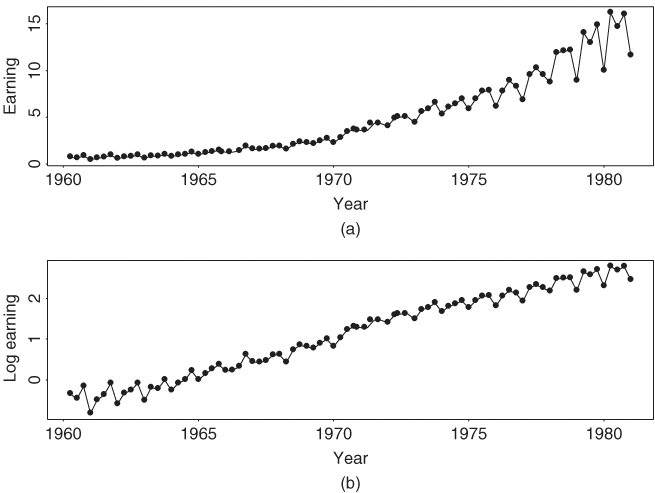
Some financial time series such as quarterly earnings per share of a company exhibits certain cyclical or periodic behavior. Such a time series is called a seasonal time series. Figure 2.13(a) shows the time plot of quarterly earnings per share of Johnson & Johnson from the first quarter of 1960 to the last quarter of 1980. The data obtained from Shumway and Stoffer (2000) possess some special characteristics. In particular, the earnings grew exponentially during the sample period and had a strong seasonality. Furthermore, the variability of earnings increased over time. The cyclical pattern repeats itself every year so that the periodicity of the series is 4. If monthly data are considered (e.g., monthly sales of Wal-Mart stores), then the periodicity is 12. Seasonal time series models are also useful in pricing weather-related derivatives and energy futures because most environmental time series exhibit strong seasonal behavior.
Figure 2.13 Time plots of quarterly earnings per share of Johnson & Johnson from 1960 to 1980: (a) observed earnings and (b) log earnings.
Analysis of seasonal time series has a long history. In some applications, seasonality is of secondary importance and is removed from the data, resulting in a seasonally adjusted time series that is then used to make inference. The procedure to remove seasonality from a time series is referred ...
Get Analysis of Financial Time Series, Third Edition now with the O’Reilly learning platform.
O’Reilly members experience books, live events, courses curated by job role, and more from O’Reilly and nearly 200 top publishers.

