A.3. LabVIEW Oscilloscope and Voltmeter (ac)
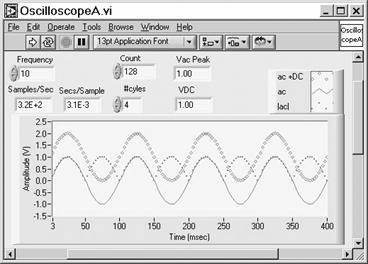
An example of an oscilloscope is shown in Fig. A.14. This special version displays three waveforms. These are the total waveform (ac + D), the sine-wave minus the dc (average value) and the absolute value of the sine-wave (|ac|).
Figure A.14. Front Panel for a possible LabVIEW oscilloscope. Digital Controls provide for inputs of Frequency, Count (number of samples), and #cycles. Digital Indicators show Samples/Sec, Sec/Sample, VDC, and Vac Peak. The limits are set in the Diagram.
The voltmeter is designed to measure peak or RMS values for periodic waveforms, thus, to be an ac voltmeter. Total sampling ...
Get Analog Electronics with LabVIEW® now with the O’Reilly learning platform.
O’Reilly members experience books, live events, courses curated by job role, and more from O’Reilly and nearly 200 top publishers.

