Introduction to the Profiler
The SQL Server Profiler (pictured in Figure 4.30) is a tool that you can use to capture SQL Server events. It allows you to:
Diagnose bottlenecks in slow-running queries
Determine the cause of deadlocks or blocking
Troubleshoot problems between client and server applications
Run security audits to record login attempts
Figure 4.30. The SQL Server Profiler allows you to capture SQL Server events.
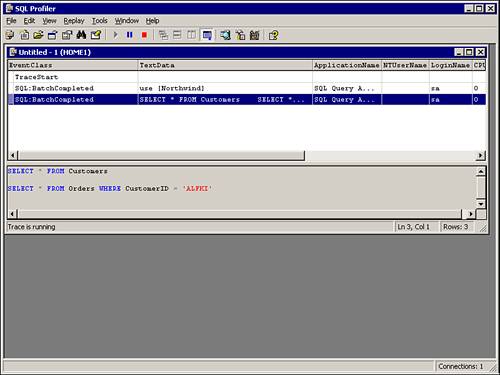
To launch the Profiler, select Tools, SQL Profiler while in Enterprise Manager, or select Profiler under the Microsoft SQL Server program group on the Start menu. To create a trace that keeps track of everything ...
Get Alison Balter's Mastering Access 2002 Enterprise Development now with the O’Reilly learning platform.
O’Reilly members experience books, live events, courses curated by job role, and more from O’Reilly and nearly 200 top publishers.

