APPENDIX I Cascade Data
NACA-65 Series Cascade Data
Cascade total pressure loss data are plotted in the shape of a “bucket” in terms of incidence angle. A definition sketch is shown.
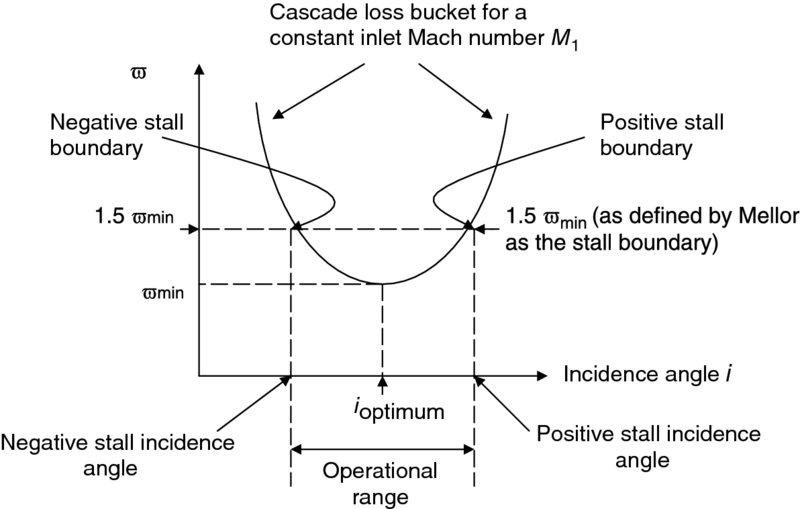
Definition sketch for the cascade stall boundaries, according to Mellor
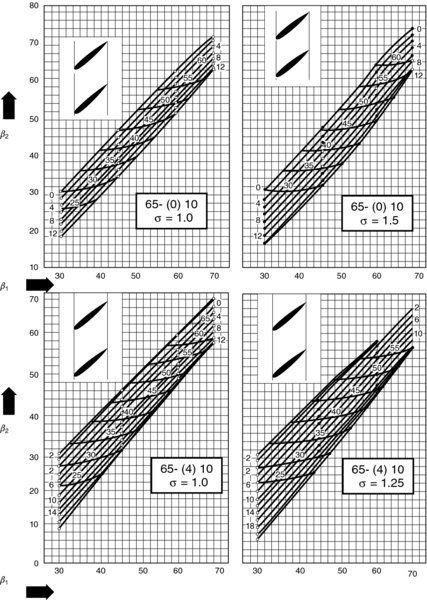
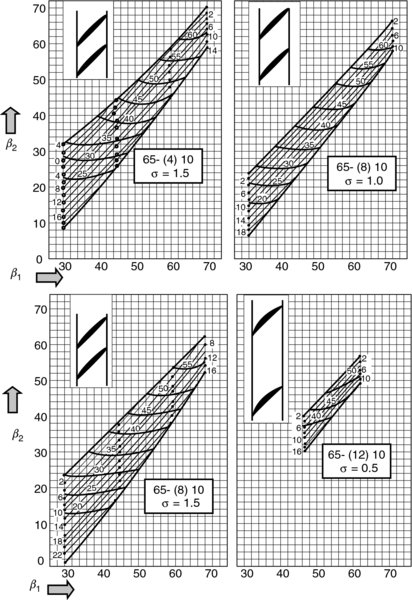
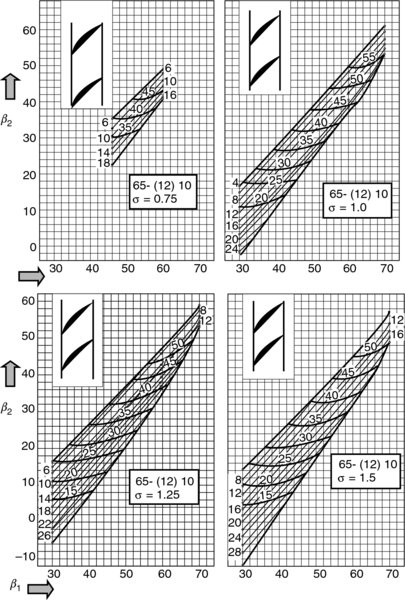
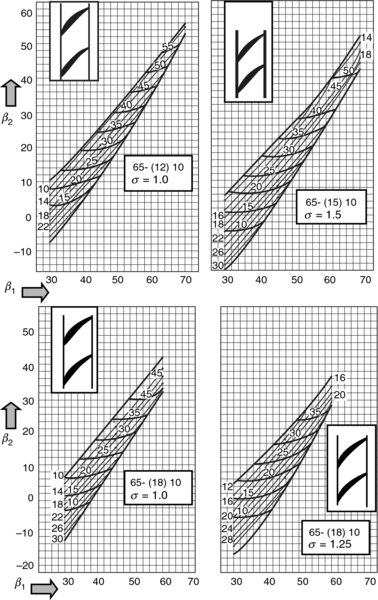
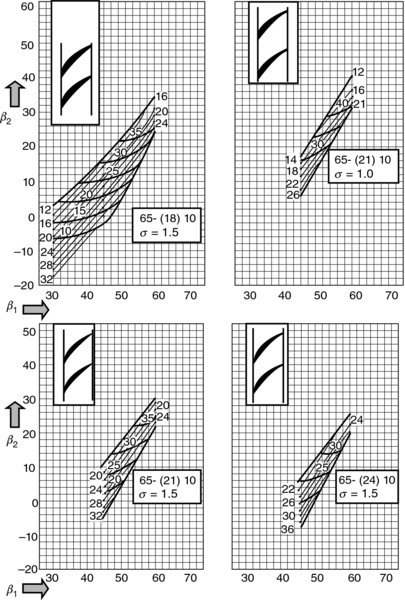
Mellor presents the operational range of each 65-series airfoils in various cascade arrangements that are very useful for preliminary design purposes. Mellor’s unpublished graphical correlations (originated at MIT’s Gas Turbine Laboratory) were published by Horlock (1973), Hill and Peterson (1992), among others. In this appendix, Mellor’s cascade data presentation is graphed according to the following definition sketch.
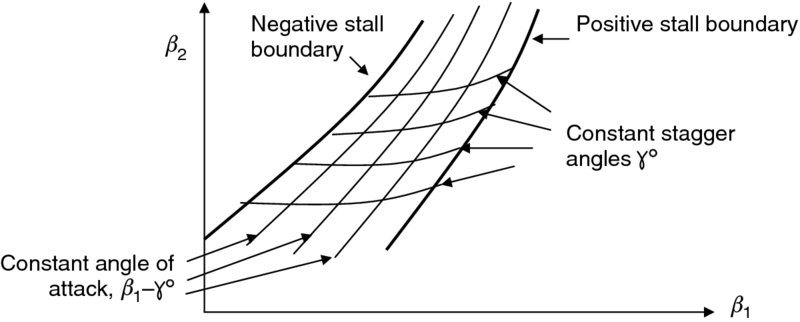
Definition sketch for the 65-series cascade data as presented by Mellor
Cascade Data
Get Aircraft Propulsion, 2nd Edition now with the O’Reilly learning platform.
O’Reilly members experience books, live events, courses curated by job role, and more from O’Reilly and nearly 200 top publishers.

