5.7 Activity: Team Radar
Use this to gather data in an iteration, release, or project retrospective.
Purpose
Help the team gauge how well they are doing on a variety of measures, such as, engineering practices, team values, or other processes.
Time Needed
Fifteen to twenty minutes.
Description
Team members track individual and group ratings for specific factors about process or development practices they want to examine.
Steps
-
Introduce the activity by saying “We agreed on these [fill in the factors] as important to our work. Let’s assess how well we are doing, using a scale of 0--10. Zero means not at all, and 10 means as much as possible.”
-
Post the flip chart with the blank radar graph. Ask each team member to approach the chart and place a dot or some other mark that shows their rating for each factor.
-
Lead a short discussion about how the factors affect the work of the team. Consider asking questions such as the following:
-
Where do you see us following these [fill in factors]?
-
Where do you not see us following these [fill in the factors]?
Use the short discussion as a segue to generating insights.
-
-
Save the completed flip chart graph. Run the activity again two or three iterations later. Compare the two charts as a progress measure.
Materials and Preparation
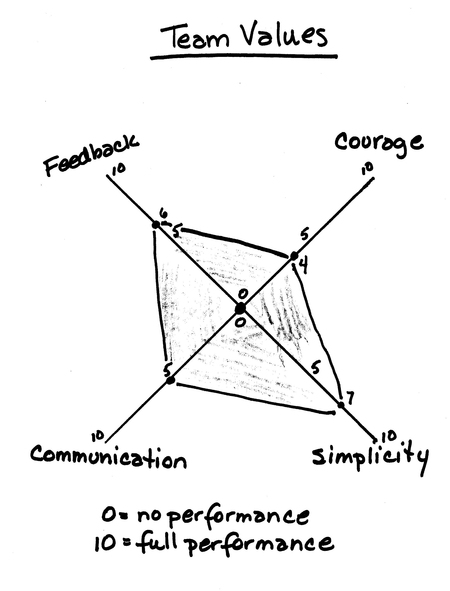
This team used the Group Average Radar to gauge how much they were following their team ...
Get Agile Retrospectives now with the O’Reilly learning platform.
O’Reilly members experience books, live events, courses curated by job role, and more from O’Reilly and nearly 200 top publishers.

